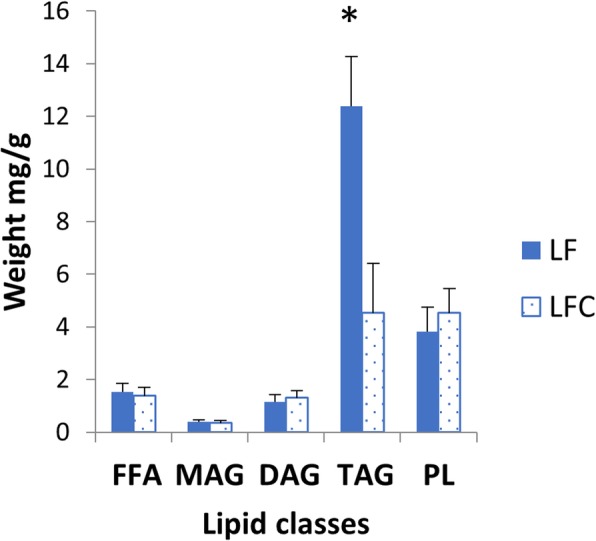
Fig. 4.

Distribution of the lipid classes; free fatty acids (FFA), monoacylglycerol (MAG), diacylglycerol (DAG), triacylglycerol (TAG) and phospholipid (PL) in pyloric caeca tissue. Values are means (n = 10) with standard errors represented by vertical bars. Significant differences (p < 0.05) between the LF and LFC group are indicated with *. The inclusion of choline resulted in a significant lower content of TAG (p < 0.05; T-test)
