Fig. 6.
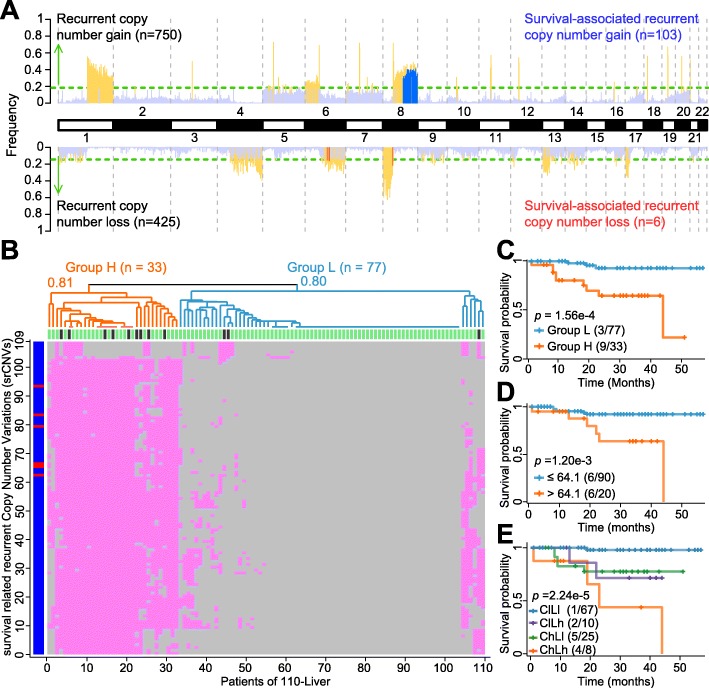
Analysis of srCNVs in the 110 Liver samples. (a) Chromosomal distribution of recurrent CNVs and srCNVs. Recurrent CN-gains are represented by yellow upward bars, recurrent CN-losses by yellow downward bars, srCN-gains by upward blue bars, and srCN-losses by downward red bars. The green horizontal lines mark the frequency thresholds for significant recurrence (0.19 for CN-gain and 0.15 for CN-loss; p < 0.05), and CN-gains and losses that fell below these thresholds were represented by light blue columns. All srCNVs were located on chromosomes 6 and 8. (b) The srCNVs were employed for hierarchical clustering of the 110 liver cancer samples. The approximately unbiased p-values after 1000 times bootstrapping for the high-srCNV group (Group H) and low-srCNV group (Group L) were given at the respective nodes. (c) Kaplan-Meier survival plots for Groups H (orange) and Group L (blue). (d) Kaplan-Meier survival plots stratified based on LOH% comprising only copy- neutral LOHs. (E) Kaplan-Meier survival plots based on LOH% and srCNV. LOH% and srCNV were jointly applied to the 110-Liver cohort to stratified them into the four subgroups according to Kaplan-Meier survival plots. Censored patients were indicated by tic marks on the survival curves

