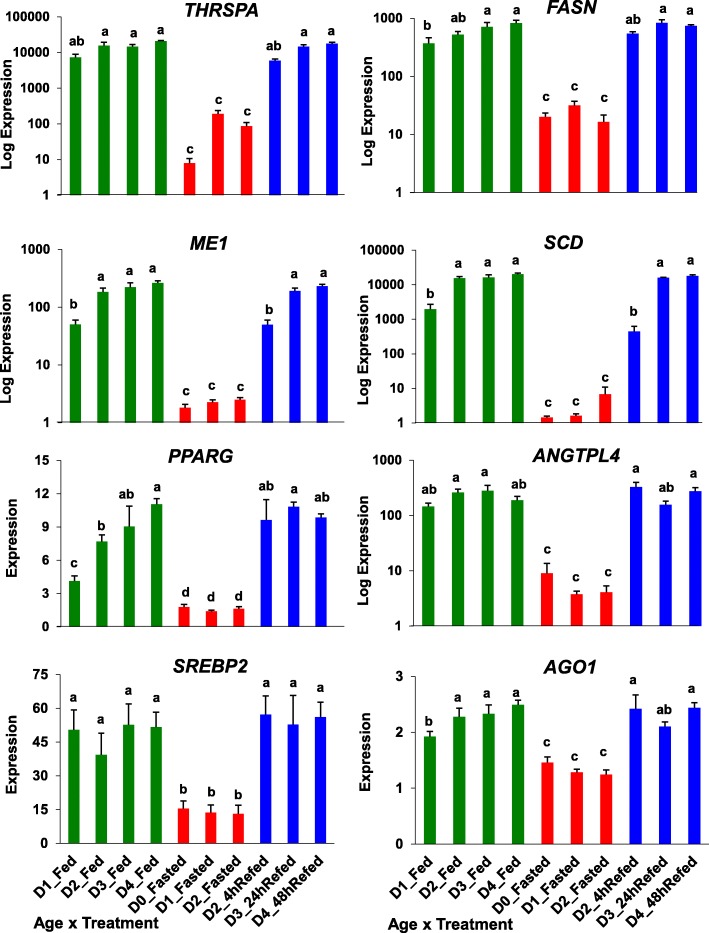
Fig. 11.
Verification of differential expression of eight lipogenic genes using qRT-PCR analysis. Nutritional state is indicated by bar color, where green = fed state, red = fasted, and blue = refed conditions. Values represent least-square means (LSM) and their standard error (LSE) of normalized expression levels of five cockerels (biological replicates) and two technical replicates. Expression levels, determined by qRT-PCR analysis, were normalized using the geNorm procedure in qBase software [59]. Values possessing different superscripts are significantly different as determined by analysis of variance (ANOVA) using the general linear models (GLM) procedure in Statistical Analysis System (SAS) software and with mean separation using Tukey’s Studentized Range Test

