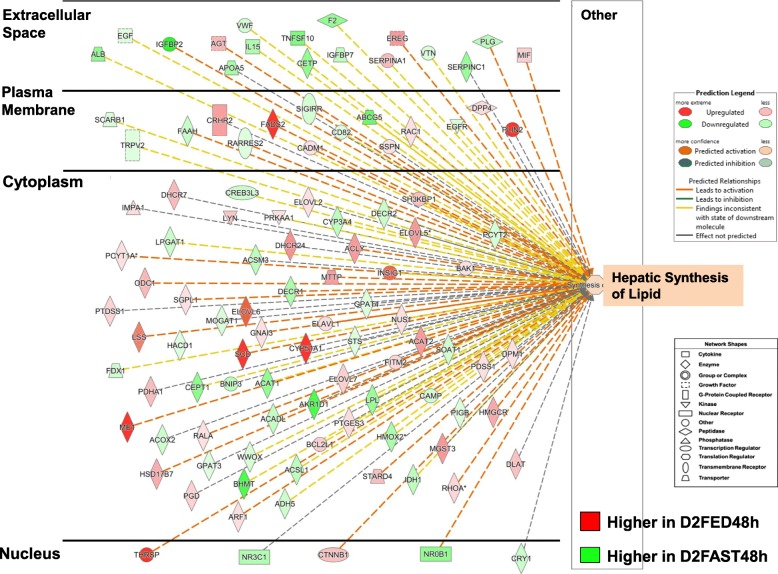
Fig. 5.
Subcellular distribution of 107 AR-DEGs functionally annotated by IPA as “Concentration of Lipids” from the D2FED48h vs. D2FAST48h contrast. This figure provides an overview of the transcriptional hierarchy of hepatic genes that control the concentration of lipids. Genes with red symbols are expressed higher in liver of D2FED48h cockerels, while green symbols indicate higher hepatic expression in the D2FAST48h treatment. A group of five upstream regulators control transcription of numerous metabolic enzymes, transporters, kinases and phosphatases in the cytoplasm, several transmembrane receptors, G-protein-coupled receptors, peptidases and enzymes in the plasma membrane, and even fewer growth factors, transporters and enzymes found in extracellular space. IPA predicts that the concentration of lipid in liver would be inhibited by the eight up-regulated transcription factors as indicated by the dashed blue lines, while yellow dashed lines represent inconsistence between the expected state and observed state of downstream genes. An annotated list of these 107 AR-DEGs controlling concentration of lipid is provided in Additional file 4

