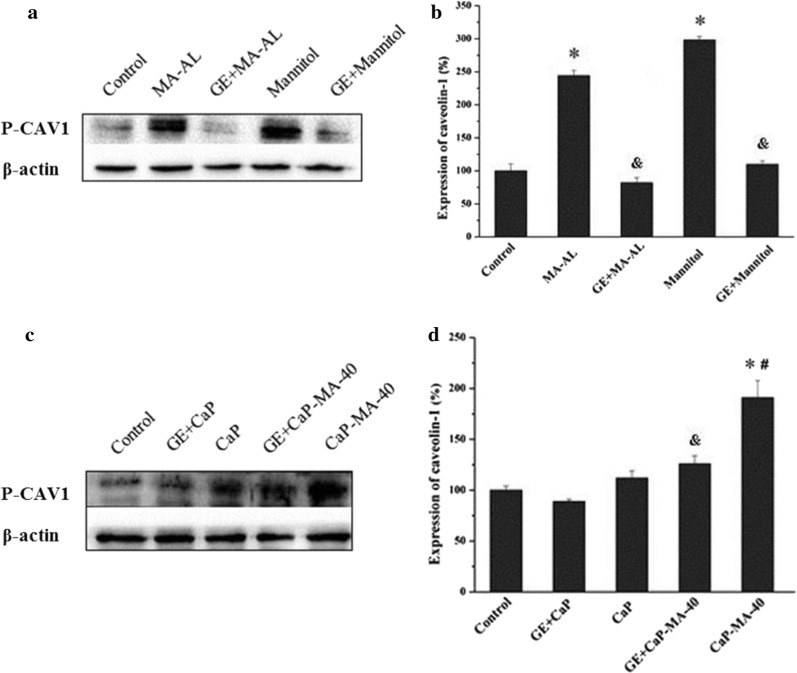
Fig. 5.
Evaluation of P-CAV1 expression by western blot experiment. a, b Cells were treated with Mannitol and MA-AL, respectively. c, d Cells were treated with CaP and CaP-MA-40 nanoparticles, respectively. GE + CaP, GE + CaP-MA-40, GE + Mannitol and GE + MA-AL groups were pre-incubated with genistein (GE) and untreated cells as the negative control, mean ± SD, n = 3. *P < 0.05, CaP, CaP-MA-40, Mannitol and MA-AL compared with control, #P < 0.05, CaP-MA-40 compared with CaP, &P < 0.05, GE + CaP-MA-40 compared with CaP-MA-40, GE + CaP compared with CaP, GE + Mannitol compared with Mannitol, and GE + MA-AL compared with MA-AL

