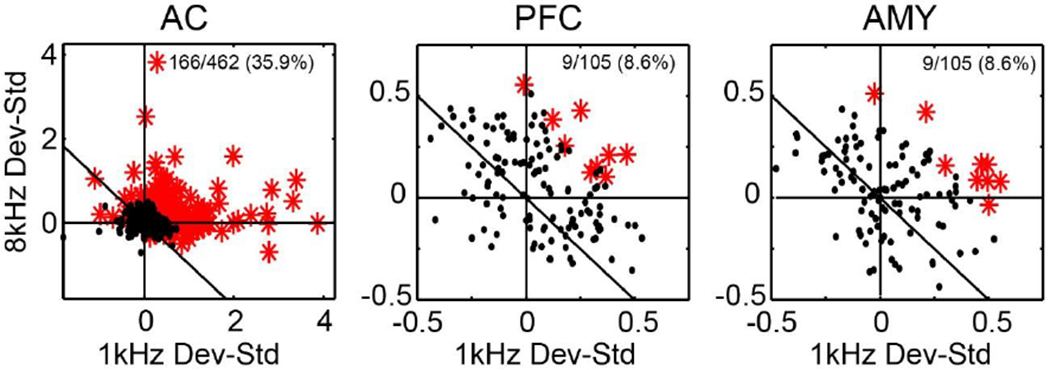
Figure 6. Individual neuron-based magnitude of novelty signal (response as deviant – response as standard) and novelty selectivity for each stimulus and area.

Single neurons which exhibited a significant novelty signal are shown in red. This fraction is lower in PFC and AMY but greater than chance, and magnitude in these areas is lower than in AC (see text). Note that at level of individual neurons, generally responses in AC are skewed towards stronger novelty responses for 1 kHz, and there is less stimulus selectivity in PFC and AMY.
