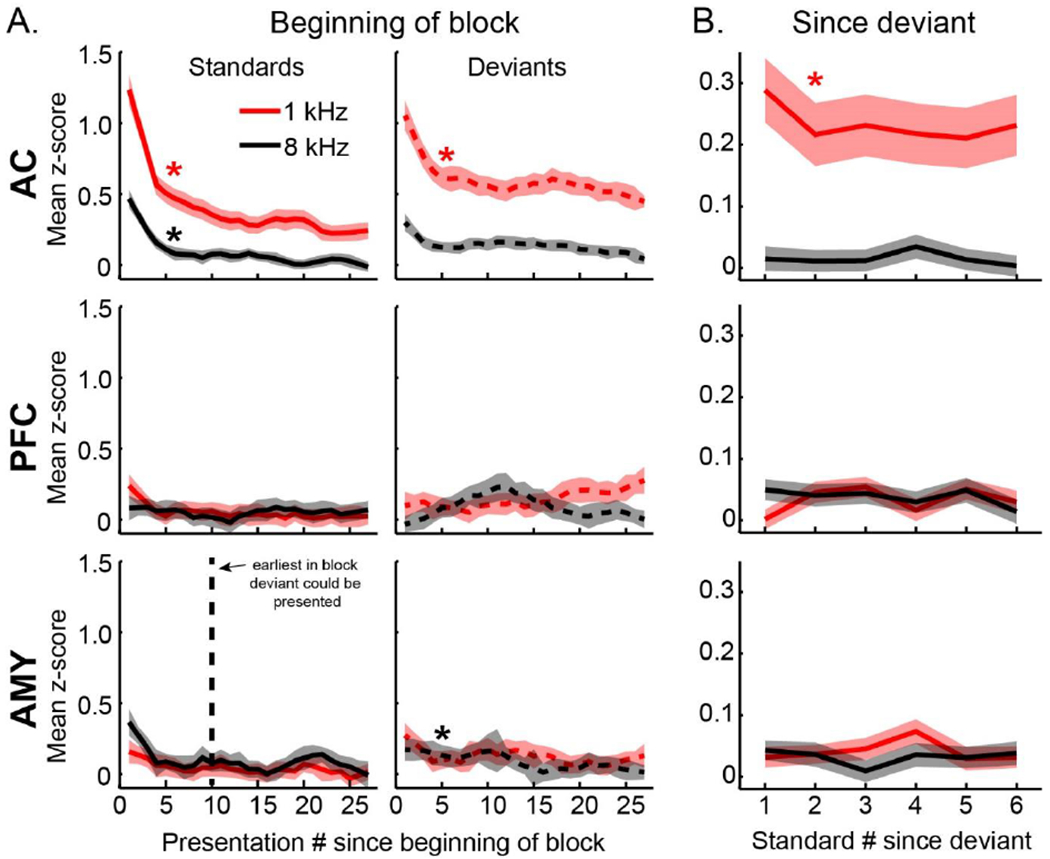
Figure 8. Adaptation effects across areas.

A. Adaptation since block start. Average response to a standard (solid) and deviant (dotted) plotted by ordinal presentation number since beginning of block for each area, stimulus, and type (shaded bars are SEM). Significant adaptation is denoted with a star. Vertical dotted line indicates the earliest that a deviant could be presented within a block (all blocks started with >10 standards). B. Adaptation since deviant. Average response to standard after presentation of a deviant for each area and stimulus (shaded bars are SEM). Plots are smoothed for visualization purposes only.
