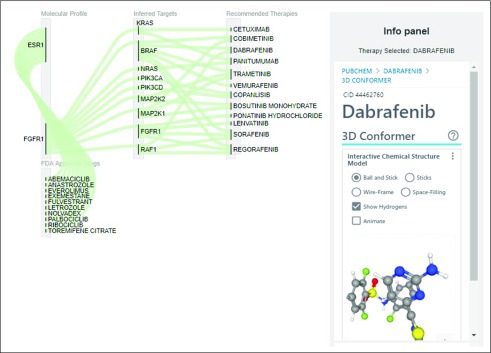
FIG 4.
Sankey flow diagram focusing on the flow of evidence between drug-gene and gene connections for a putative patient with estrogen receptor–positive breast cancer and FGFR1 overexpression, showing category 3 recommendations, namely, targets downstream of FGFR1. Therapies can be clicked to obtain a panel with PubChem information.

