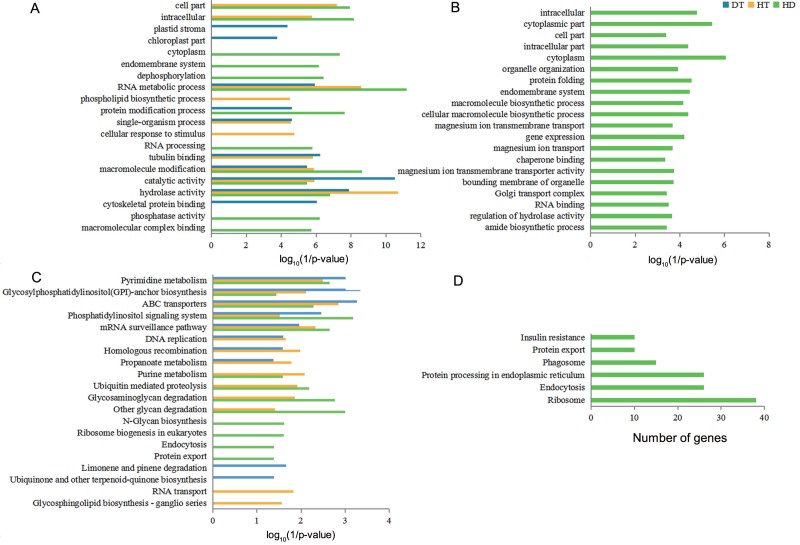
Figure 5. GO terms and KEGG pathways analysis of DSGs under DT, HT and HD.
(A) The bar chart showing 20 GO terms that significantly enriched in DSGs in response to DT, HT and HD. (B) The bar chart showing 20 GO terms that significantly enriched in HD-specific DSGs. (C) The bar chart showing 20 KEGG pathways that significantly enriched in DSGs in response to DT, HT and HD. (D) The bar chart showing all KEGG pathways that significantly enriched in HD-specific DSGs. The significantly enriched GO terms and KEGG pathways were selected based upon a p-value cut-off of 0.05.

