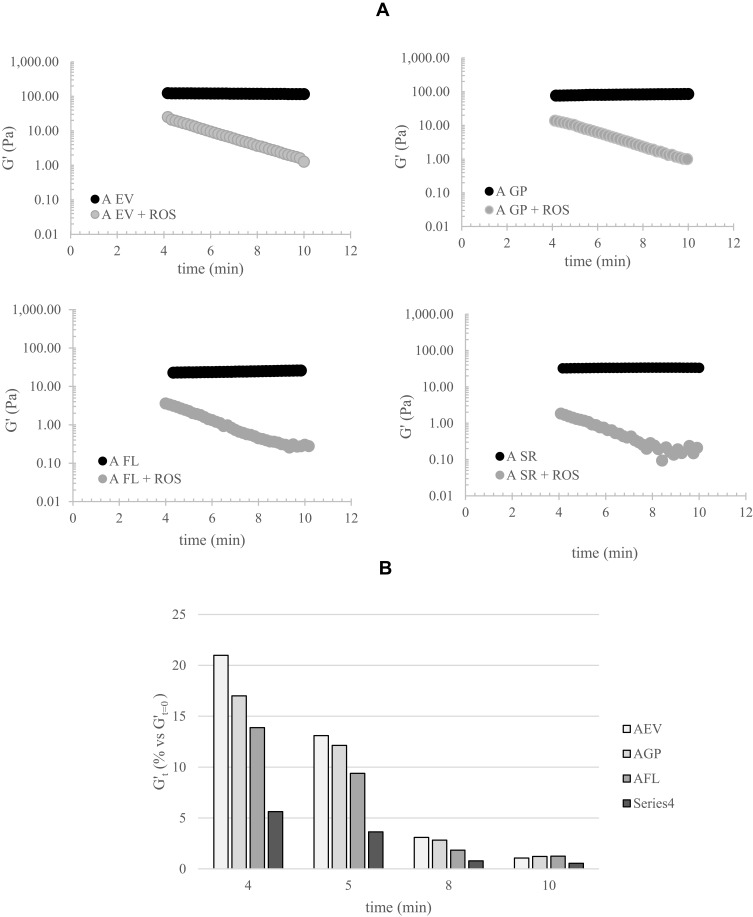
Figure 3.
Gel degradation in the presence of ROS. (A) G′ values for the gels during incubation with ROS, compared to a control (filler incubated with water). (B) Quantitative evaluation of the degradation rate: extent of G′ decreases, normalized to the control (%), at increasing time of incubation with the ROS generating system. The data refer to a single measurement.

