Figure 1.
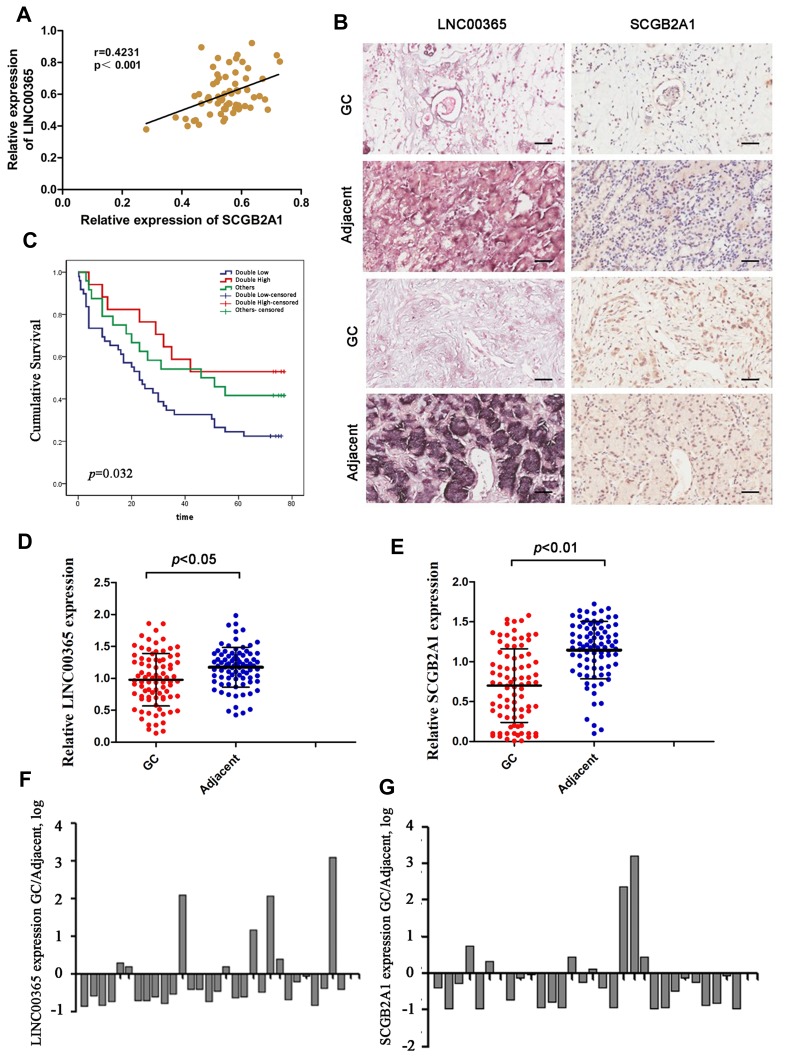
The expression of LINC003365 and SCGB2A1 in gastric cancer tissues. (A) Pearson’s correlation coefficient analysis for LINC00365 and SCGB2A1 expression in gastric cancer tissues. (B) Representative images of LINC00365 and SCGB2A1 expression in human gastric cancer tissues and adjacent tissues (scale bar=20µm). SCGB2A1 was analyzed by IHC and LINC00365 was detected by ISH. (C) Kaplan–Meier survival curve showing a significant association between LINC00365 and SCGB2A1 expression and survival in gastric cancer patients (P=0.032). Double high: higher expression of both LINC00365 and SCGB2A1 in gastric cancer tissues compared with adjacent tissues (n=17); Double low: low expression of both LINC00365 and SCGB2A1 in gastric cancer tissues compared with adjacent tissues (n=49); other: higher expression of either LINC00365 or SCGB2A1 in gastric cancer tissues compared with the adjacent tissues (n=24). (D, E) The expression of SCGB2A1 and LINC00365 in gastric cancer tissues and adjacent tissues. Statistical significance was determined using a two-tailed, unpaired Student’s t-test. (F, G) Relative mRNA expression of SCGB2A1 and LINC00365 in tissues from 30 gastric cancer patients.

