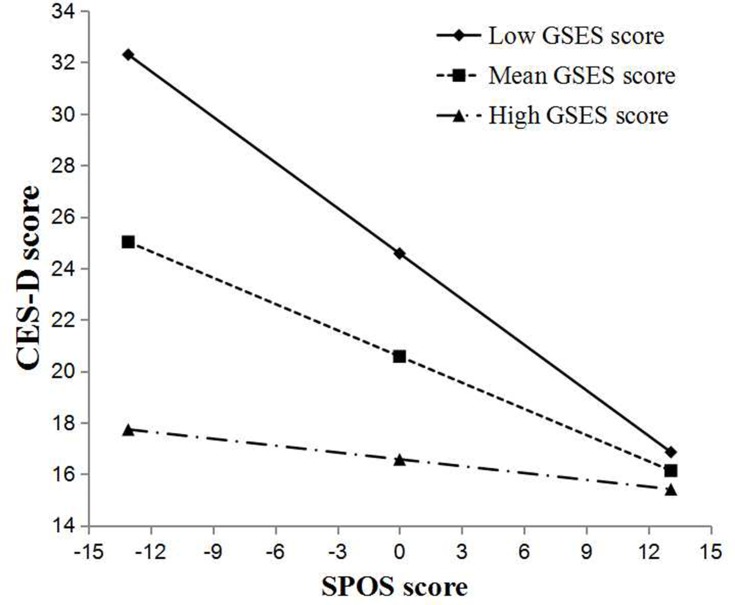
Figure 1.
Simple slope plot of interaction between SPOS score and GSES score on CES-D score.
Notes: Low, 1 SD below the mean; high, 1 SD above the mean.
Abbreviations: SD, standard deviation; CES-D score, score of depressive symptoms; SPOS score, score of perceived organizational support; GSES score, score of self-efficacy.

