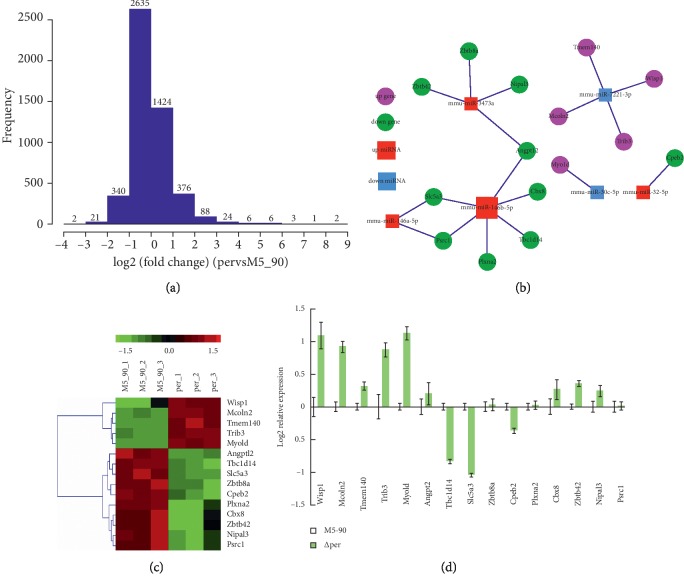
Figure 3.
The differentially expressed mRNAs obtained from RAW264.7-M5 and RAW264.7-∆per by the array-based initial screen. (a) The fold change between the biological samples. The X-axis indicated log2 (FC), while the Y-axis indicated the numbers of the differentially expressed gene transcripts. (b) miRNA-mRNA interaction network of differentially expressed miRNAs and their fifteen putative targets. mmu-miR-146a, mmu-miR-155-5p, and mmu-miR-146b-5p were upregulated (red), and their ten putative target genes were downregulated (green); mmu-miR-3473a and mmu-miR-30c-5p were downregulated (blue), and their five putative target genes were upregulated (pink). (c) Heat-map obtained from mRNA array indicated the upregulation of five genes (Wisp1, Mcoln2, Tmem140, Trib3, and Myold) (red) and the downregulation of ten genes (Angptl2, Tbc1d14, Slc5a3, Zbtb8a, Cpeb2, Plxna2, Cbx8, Zbtb42, Nipal3, and Psrc1) (green) (p < 0.05). (d) Relative expression levels of the fifteen targets gene were validated by qRT-PCR. nTbc1d14 and Slc5a3 were identified as the differentially expressed genes by qRT-PCR. Data are mean ± SD from three independent experiments. ∗p < 0.05; ∗∗p < 0.01.

