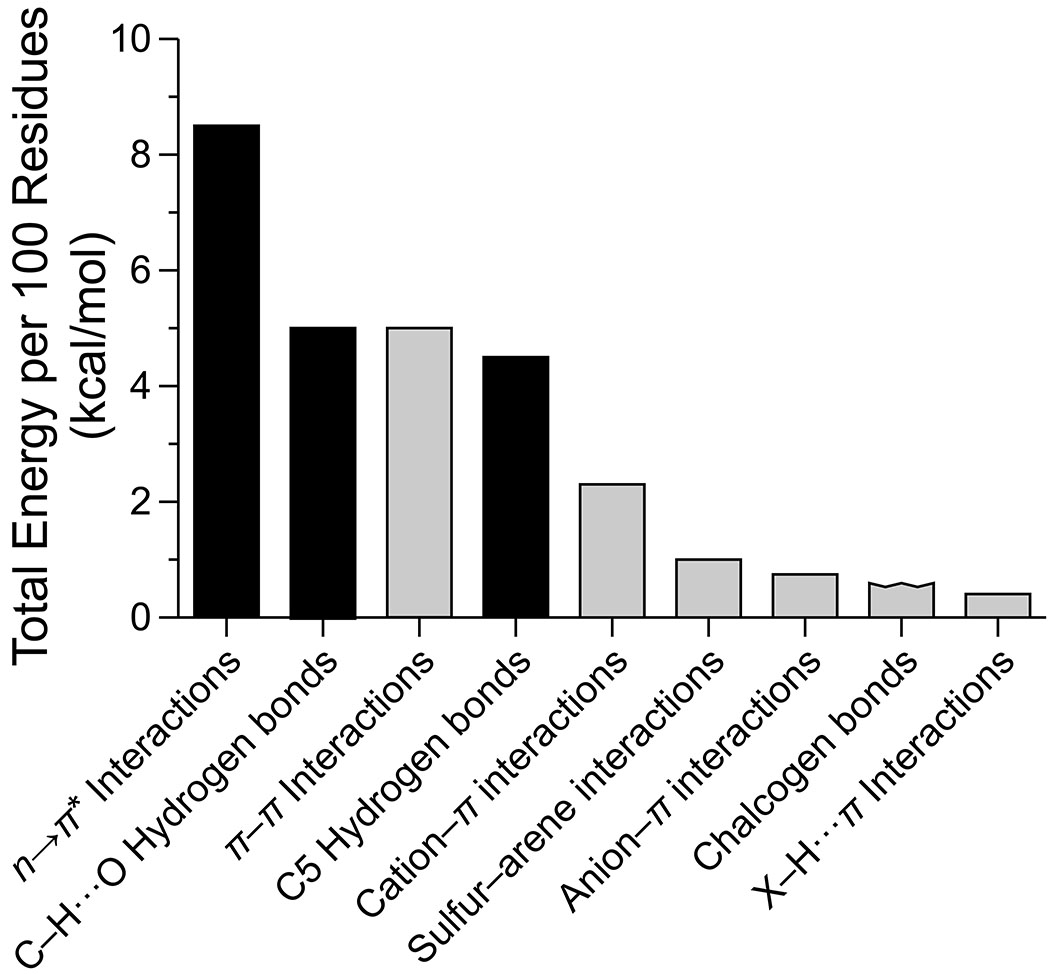
Figure 3.
Bar graph of the estimated enthalpic contribution of secondary interactions to the conformational stability of globular proteins. Black bars, interactions of the main chain (Figure 1); gray bars, interactions involving side chains (Figure 2). Data are from Table 1. The sum of the energies is ~27 kcal/mol per 100 residues.

