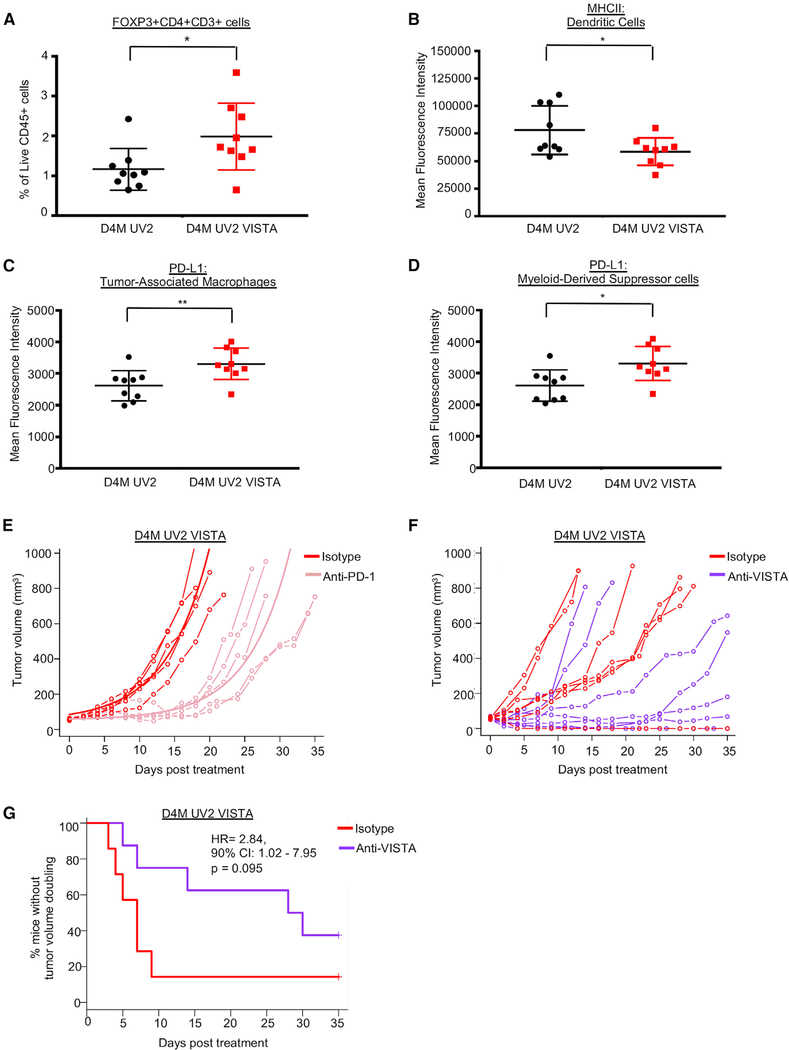
Figure 4. VISTA Expression Promotes an Immunosuppressive Microenvironment, but Does Not Alter Response to PD-1.
(A) Tumors were analyzed for tumor-infiltrating lymphocytes 7 days after injection. The presence of FOXP3+CD4+CD3+ T regulatory cells was determined by flow cytometry as a percentage of cells gated as Live and CD45+. Data were collected from 9 mice per group, combined from 2 independent experiments. *p < 0.05.
(B) As in (A), dendritic cells (gated as Live F4/80−CD11c+MHCNhiCD3−CD45+) were analyzed for MHC II levels by flow cytometry, and mean fluorescence intensity (MFI) was quantified. *p < 0.05.
(C) As in (A), tumor-associated macrophages (TAMs) (gated as Live CD11b+F4/80+CD3−CD45+) were analyzed for PD-L1 positivity. MFI of PD-L1+ cells was quantified in the TAM immune cell population. **p < 0.01.
(D) As in (A), myeloid-derived suppressor cells (MDSCs) (gated as Live CD11b+GR-1+CD3−CD45+) were analyzed for PD-L1 positivity. MFI of PD-L1+ cells was quantified in the MDSC immune cell population. *p < 0.05.
(E) D4M UV2 VISTA cells were injected into C57BL/6 mice. When tumors reached ~50 mm3, animals were treated with either anti-PD-1 antibody or the corresponding isotype control (rat IgG2a) every 2–3 days. Data were collected from 5 mice treated with isotype and 6 mice treated with anti-PD-1. One animal in the anti-PD-1 treatment group with zero tumor volume was excluded from the statistical analyses of tumor growth curves. For the remaining animals, the fitted group average tumor growth curves are depicted by a bold line. Anti-PD-1 treatment delayed tumor growth on average by 12.2 days (95% CI 6.5–17.8, p = 0.001) as compared to the control group.
(F) D4M UV2 VISTA cells were injected into C57BL/6 mice. When tumors reached ~50 mm3, animals were treated with either anti-VISTA antibody or the corresponding isotype control (hamster polyclonal IgG) every 2–3 days. Data were collected from 7 mice treated with isotype and 8 mice treated with anti-VISTA.
(G) The time to doubling was defined as the first observation day when the tumor volume exceeded twice the volume at day 0. Animals with tumor volumes that did not double at any time were censored on the last day of observation. The time to doubling was analyzed using the Kaplan-Meier estimator of the survival curves and Cox proportional hazards model.
See also Figures S4 and S5.

