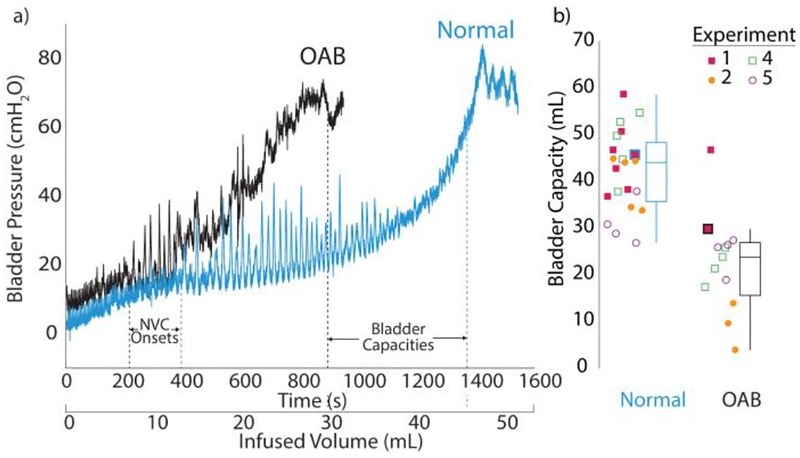
Fig. 2.
a) Example bladder fills sequences for saline (in blue) and acetic acid (in black) infusions from experiment 1. b) Summary of bladder capacities in experiment 1, 2, 4 and 5 in box plots. Simulated OAB capacities (n = 13) were significantly lower than normal bladder capacities (n = 21; p < 0.0001). Icons for fills in (a) indicated with thick outline in blue or black.

