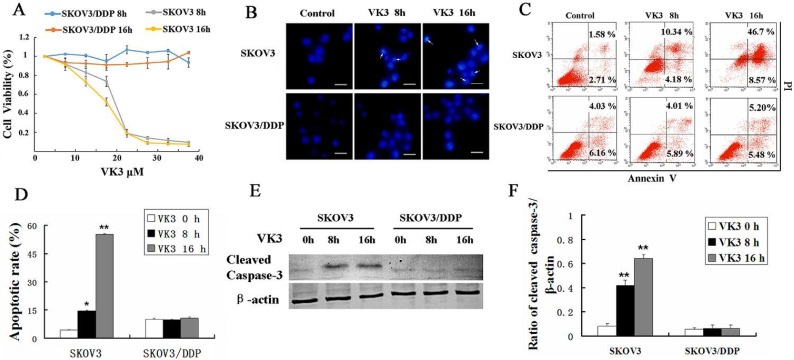
Figure 1.
VK3 promoted the apoptosis of SKOV3 ovarian cancer cells. (A) SKOV3 and SKOV3/DDP cells were treated with VK3 for 8 and 16 h. The MTT assay was used to examine the cell viability. Data are presented as mean ± SD, n = 3. (B) Both cells were treated with 15 µM VK3 and stained with Hoechst 33342. Cell morphology was observed by fluorescence microscopy. Arrows indicate apoptotic cells. Scale bar = 20 µm. (C) Cells were stained with Annexin V-FITC/PI, and the ratio of apoptosis was detected using a FACScan flow cytometer. Data are presented as mean ± SD, n = 3. (D) Apoptotic rate in (C) was quantified in both cells. Data are presented as mean ± SD, n = 3. *P < 0.05 and **P < 0.01 compared with untreated cells. (E) Western blotting was used to analyze the expression of cleaved caspase-3. (F) The expression of cleaved caspase-3 was quantified. Data are presented as mean ± SD, n = 3. **P < 0.01 compared with untreated cells.

