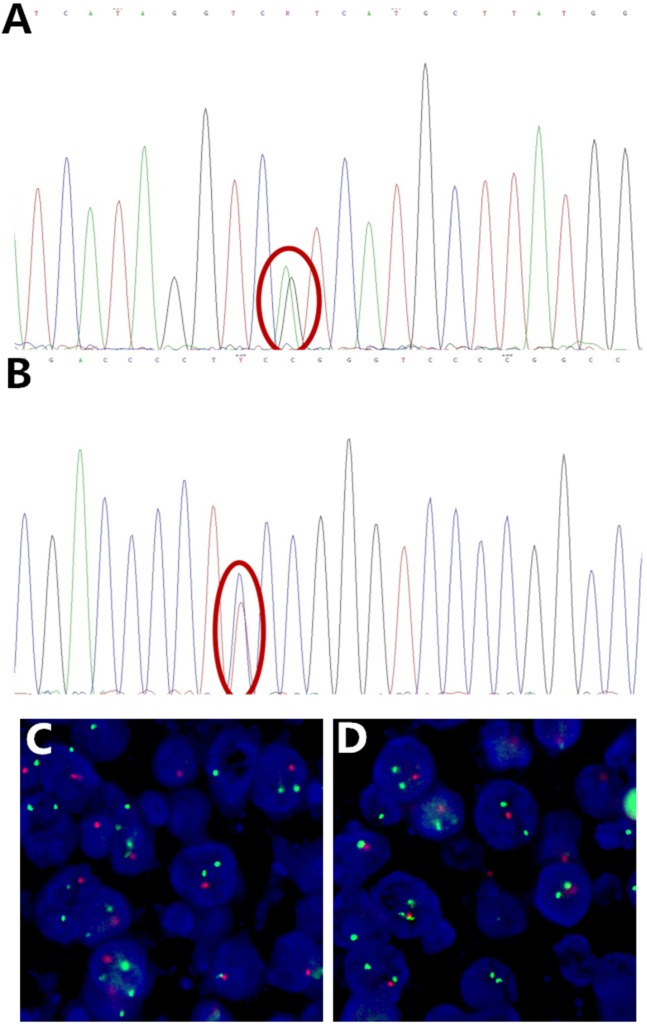
Figure 2.
Representative Sanger sequencing images of IDH mutation, TERT promoter mutation and FISH image of 1p/19q deletion. (A) IDH1 R132H mutation (red circle), (B) TERT promoter C250T mutation (red circle), (C) 1p deletion, (D) 19q deletion, with 1 red and 2 green signals in scattered nuclei. Some signals are missing due to nuclear truncation and overlap.

