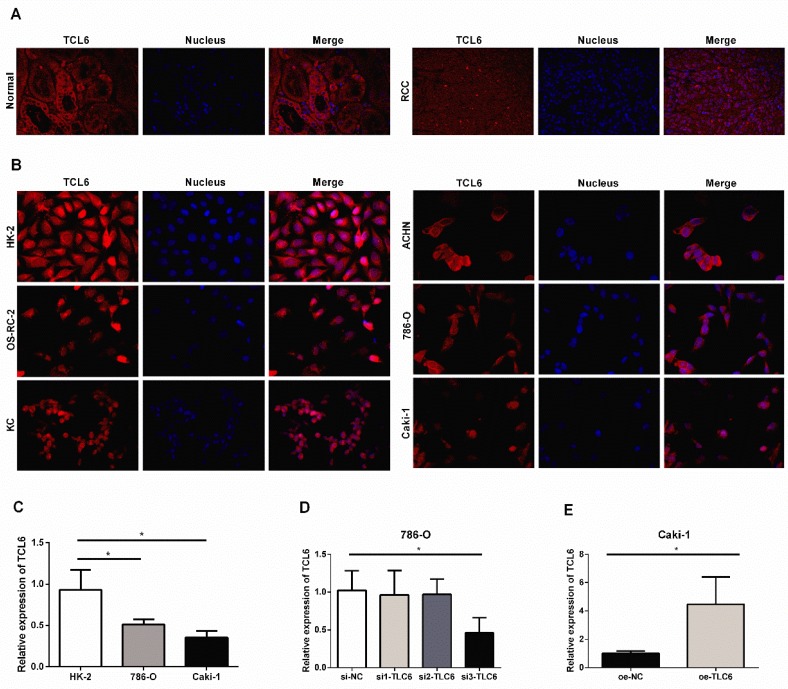
Figure 2.
The relative expression levels of TCL6 in RCC tissues cells. A. Confocal FISH images exhibited expression and localization of TCL6 in RCC and adjacent normal renal tissues. TCL6 (red signal) was mainly located in the cytoplasm. Blue DAPI for nucleus staining. B. The levels of TCL6 expression was detected by FISH in HK-2 cells and 5 RCC cell lines. There were less red signals in 5 RCC cell lines compared to HK-2 cells. C. The basal expression of TCL6 in HK-2, 786-O, and Caki-1 cells was evaluated by qRT-PCR. D. 786-O cells were transfected with TCL6 siRNA1, siRNA2, siRNA3, and NC siRNA, respectively. qRT-PCR revealed the expression levels of TCL6 were significantly reduced by treatment with TCL6 siRNA 3. E. The expression levels of TCL6 were elevated in Caki-1 cells transfected with TCL6 overexpression plasmids compared to those cells were treated with the negative control plasmids. Data are shown as means ± SD (n=3). FISH: fluorescence in situ hybridization; *P<0.05.

