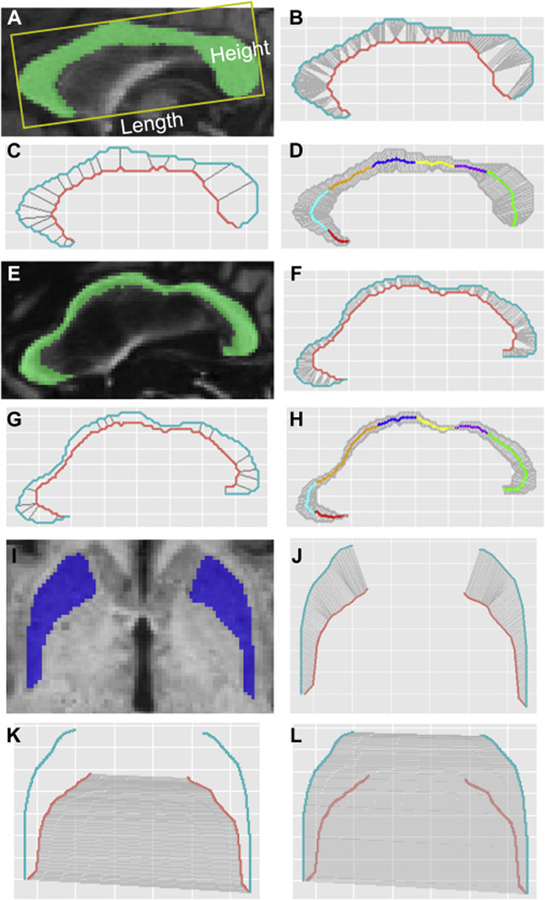
Fig. 1. Morphological measurements of the CC and putamen.
(A-D) A 63-year-old patient at FXTAS stage 2 without substantial morphological changes in the CC. (E-H) A 78-year-old patient at FXTAS stage 3 with substantial morphological changes in the CC. (A) CC length and height. (A, E) CC segmentation. (B, F) The determination of inflection points on the lower boundary (orange curve). (C, G) CC sections (gray straight lines). (D, H) 300 CC segments and anatomic subregions determined using Witelson’s method (Witelson, 1989): red, the rostrum (CC1); cyan, genu (CC2); orange, rostral body (CC3); blue, anterior midbody (CC4); yellow, posterior midbody (CC5); purple, isthmus (CC6); and green, splenium (CC7). (I) Segmentation of the putamen. (J) 150 segments of the putamen. (K) The calculation of putamen inner distance using the 150 gray lines linking the corresponding points on the inner boundaries (orange) of the left and right putamen. (L) The calculation of putamen outer distance using the 150 gray lines linking the corresponding points on the outer boundaries (blue) of the left and right putamen.

