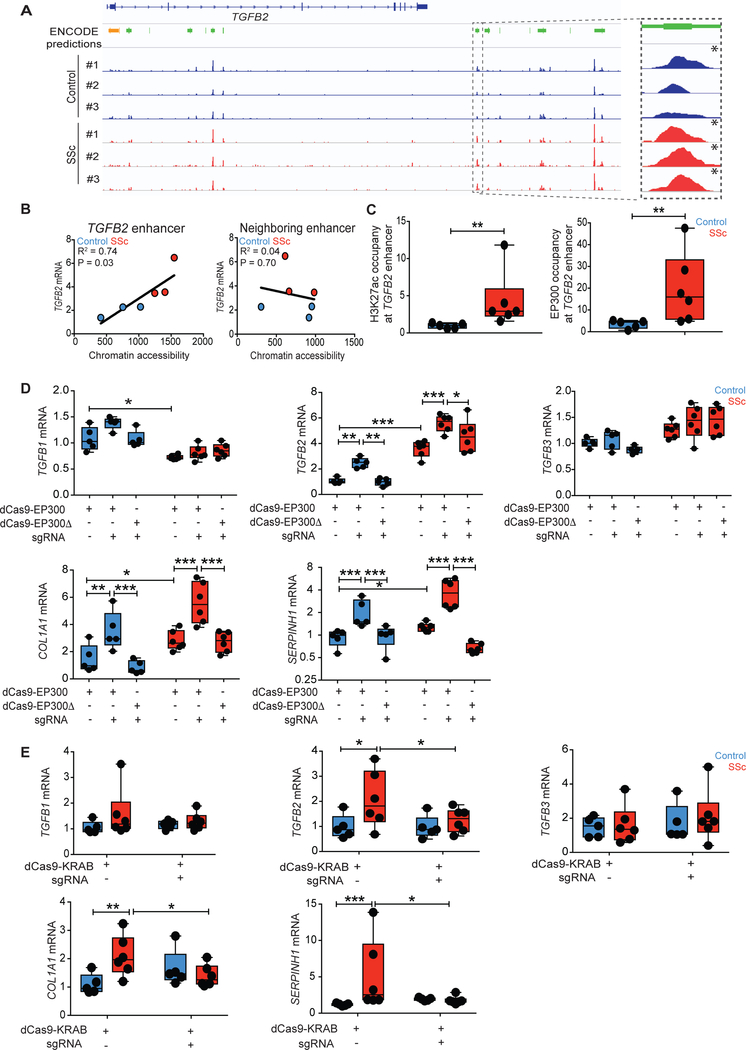
Fig. 2. Epigenetic activation of the TGFB2 enhancer promotes pro-fibrotic gene expression in SSc fibroblasts.
(A) ATAC-seq signals between healthy control and SSc fibroblasts at the TGFB2 locus were compared to ENCODE predictions for proximal promoter (orange) or putative enhancers (green), with the candidate enhancer of interest highlighted on the right. Genome-wide significant peaks at the TGFB2 enhancer are indicated by asterisks. (B) TGFB2 mRNA expression was regressed on estimated chromatin accessibility of the putative enhancer in control and patient fibroblasts. R2, co-efficient for determination of linear regression. (C) Chromatin immunoprecipitation followed by qPCR (ChIP-qPCR) demonstrated H3K27ac or EP300 occupancy at the putative TGFB2 enhancer in fibroblasts. Values are represented as percent input normalized by IgG control. (D) mRNA expression after targeted histone acetylation of the TGFB2 enhancer by co-expression of TGFB2 enhancer-specific guide RNA (sgRNA) and dCas9-EP300 (histone acetyltransferase, dCas9-EP300core) in control and SSc fibroblasts. dCas9-EP300Δ (dCas9-EP300D1399Y) contained a nonfunctional residue substitution at the acetyltransferase domain and was used as a negative control. (E) Targeting of dCas9-KRAB (histone methyltransferase) to the TGFB2 enhancer using TGFB2 enhancer-specific guide RNAs in control and SSc fibroblasts. *P < 0.05; **P < 0.01; ***P < 0.001. ncontrol = 5 and nSSc = 6. Two-way Student’s t-test or one-factor ANOVA with FDR correction were used for all experiments, except for panel C-H3K27ac: Mann-Whitney; panel D-TGFB1 mRNA, panel E-COL1A1 mRNA and panel E-SERPINH1 mRNA: Kruskall-Wallis with FDR correction. Black points represent individual biological replicates. Y-axes are varied across similar plots to aid visualization.

