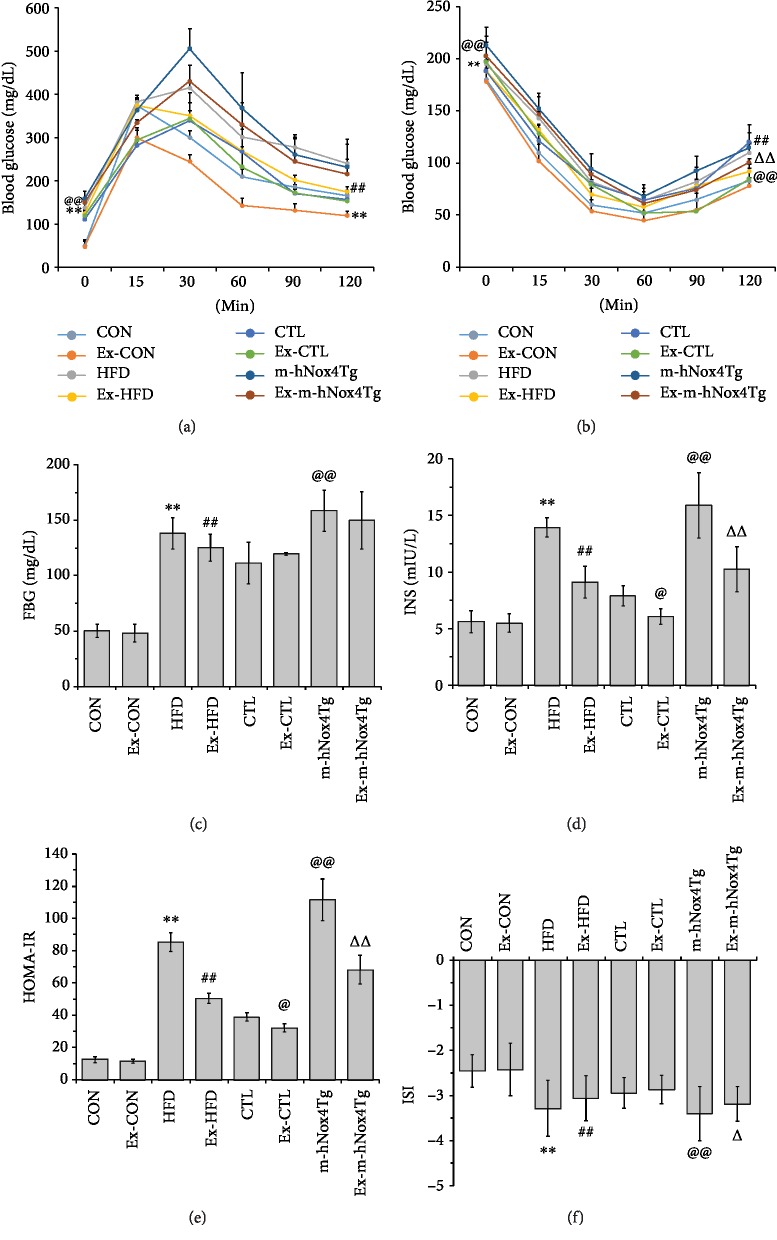
Figure 1.
Evaluation of insulin resistance. (a) IGTT curves of mice in each group. (b) IITT curves of mice in various groups. (c) The fasting blood glucose in three groups at the 8th week. There were no significant differences in the fasting blood glucose measured after an 8-week swimming exercise intervention compared with the untreated high-fat diet group. (d) The fasting blood insulin in three groups at the 8th week. There was a significant decrease in the fasting blood insulin that was measured after an 8-week swimming exercise intervention compared with the untreated high-fat diet group. (e, f) HOMA-IR and ISI values of different groups at the 8th week, which were also selected to evaluate IR. After training with swimming exercise, HOMA-IR and ISI were both improved. Data are presented as mean ± SD. ∗∗P < 0.01 versus the CON group; ##P < 0.01 versus the HFD group. @@P < 0.01 versus the CTL group; △△P < 0.01 versus the m-hNox4Tg group.

