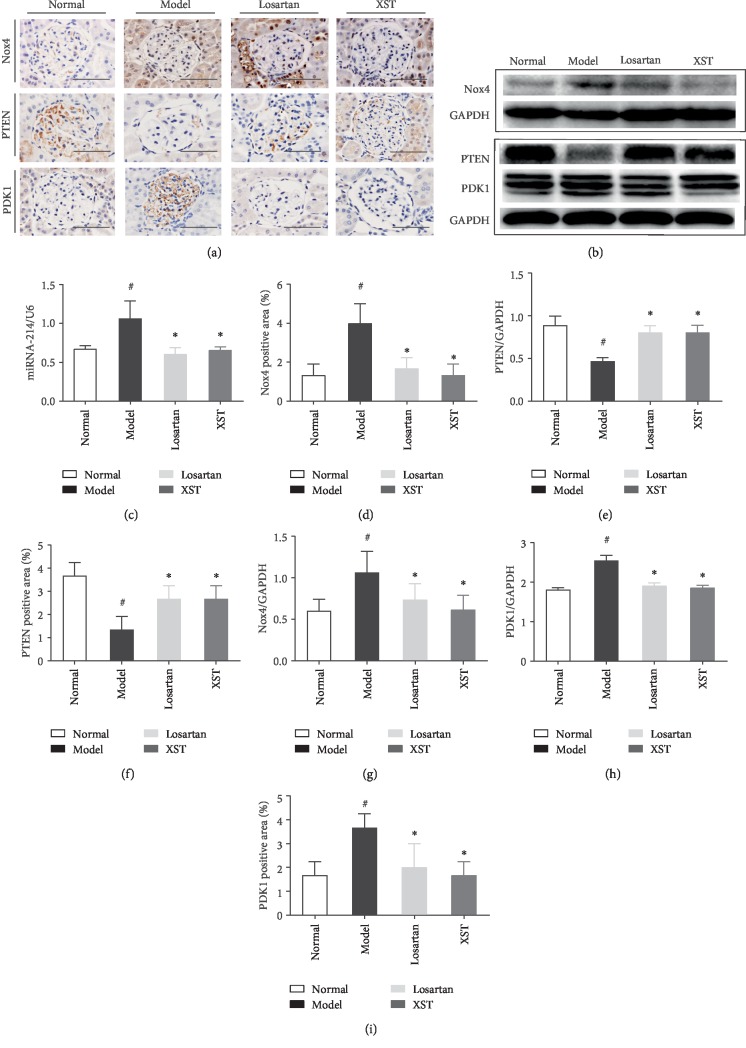
Figure 4.
Effects of XST on Nox4, miRNA-214, PTEN, and PDK1 expression in diabetic rats. Representative immunohistochemical staining (a) and western blotting (b) for Nox4, PTEN, and PDK1 in glomerulus. Representative real-time quantitative PCR for miRNA-214 (c). Quantitative analysis for Nox4, PTEN, and PDK1 (d–i). Scale bar = 100 μm. #P < 0.05 vs. normal; ∗P < 0.05 vs. model.

