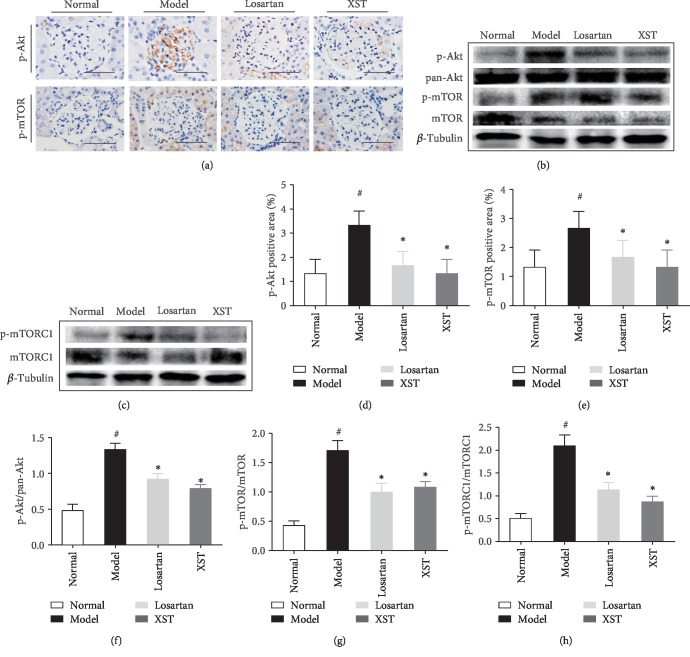
Figure 5.
Effects of XST on p-Akt, p-mTOR, and p-mTORC1 expression in diabetic kidneys. Representative immunohistochemical staining (a) and western blotting (b, c) for p-Akt, p-mTOR, and p-mTORC1 in glomerulus. Quantitative analysis for p-Akt, p-mTOR, and p-mTORC1 (d–h). Scale bar = 100 μm. Results were expressed as the means ± SEM. #P < 0.05 vs. normal; ∗P < 0.05 vs. model.

