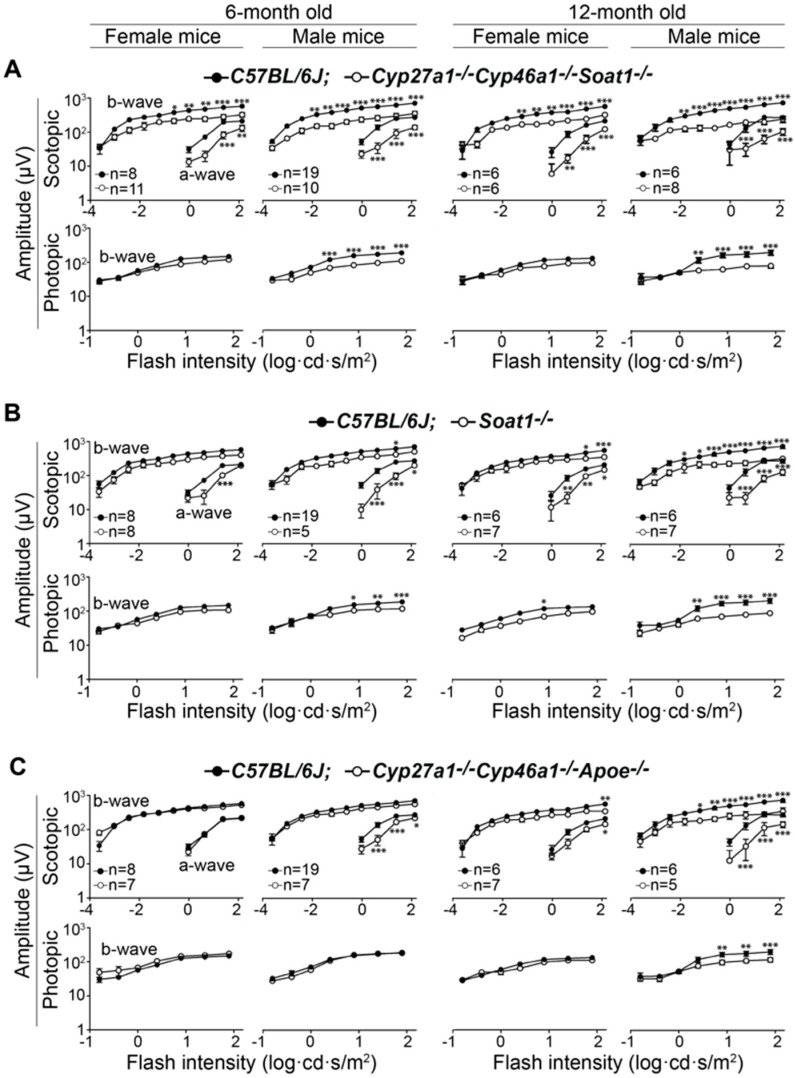
Figure 3.
Electroretinography responses in 6- and 12-month old Cyp27a1−/−Cyp46a1−/−Soat1−/− (A), Soat1−/− (B), and Cyp27a1−/−Cyp46a1−/−Apoe−/− (C) mice, which were compared with those in C57BL/6J mice. The results are presented as means ± SEM of the measurements in 5–19 animals. * p ≤ 0.05; ** p ≤ 0.01; *** p ≤ 0.001 as assessed by repeated measures two-way ANOVA, where flash intensity was used as a repeated variable and interaction between sex and genotype was evaluated for significance.

