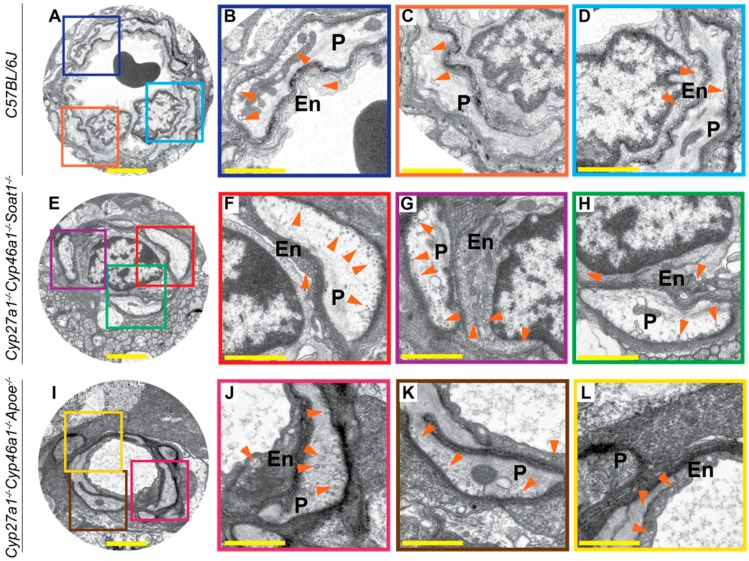
Figure 10.
Retinal ultrastructure as assessed by TEM. Colored squares in A, E, I denote regions in the neurovascular units of the ganglion cell layers that are shown at a higher magnification in B–D, F–H, J–L. Orange arrowheads denote some of the vesicles. En, vascular endothelium; P, pericyte. A–H: Images are representative of three mice per genotype. I–L: Only one animal was imaged. All mice were 7-month old males. Scale bars: 2 μm (A,E,I); 1 μm (B–D,F–H,J–L).

