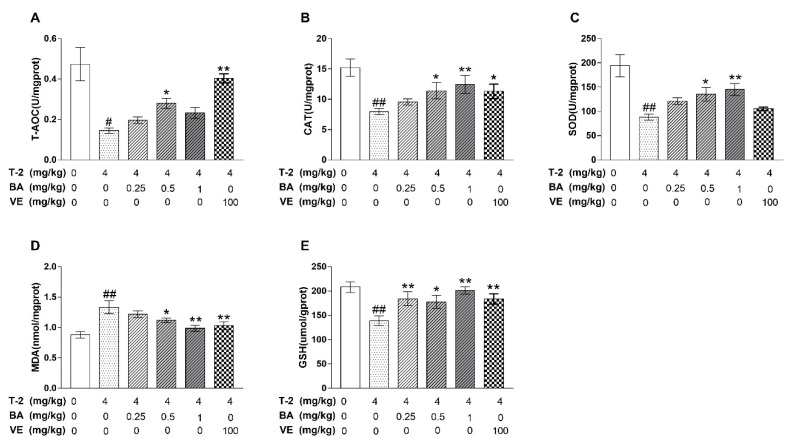
Figure 2.
The effects of BA on oxidative stress induced by T-2 in mice. (A) Total antioxidant capacity (T-AOC) level; (B) catalase (CAT) level; (C) superoxide dismutase (SOD) level; (D) malondialdehyde (MDA) content; (E) glutathione peroxidase (GSH) content. The values are presented as the mean ± SEM. Compared with the control group, # p < 0.05, ## p < 0.01, and compared with T-2 toxin group, * p < 0.05, ** p < 0.01.

