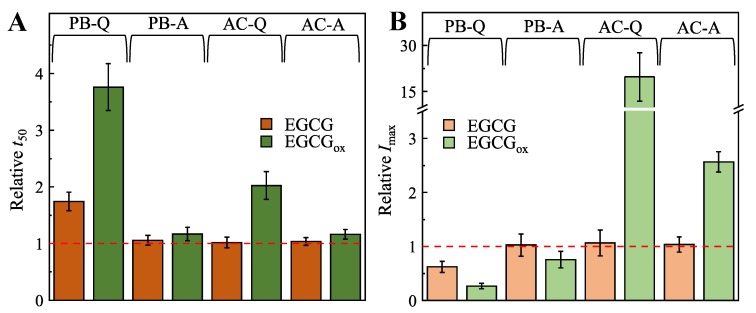
Figure 1.
Effects of EGCG and EGCG on insulin aggregation kinetics (A) and maximum ThT fluorescence intensity (B). Abbreviations PB and AC represent environmental conditions (100 mM phosphate buffer and 20% acetic acid, respectively), while Q and A denote the agitation conditions (quiescent and agitated, respectively), under which the insulin aggregation reactions were performed. Error bars represent standard deviations.

