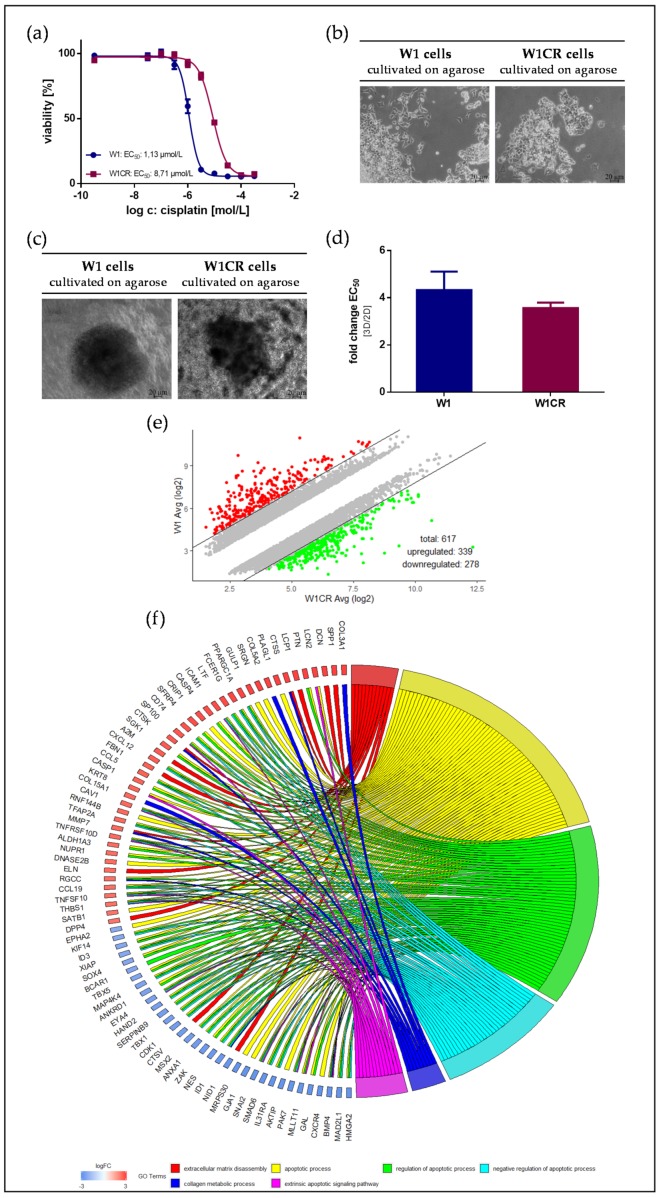
Figure 1.
Characteristics of W1 and W1CR ovarian cancer cells with respect to cisplatin cytotoxicity and cell growth: (a) Representative data set of an MTT assay of W1 and W1CR cells (5000 cells) treated with cisplatin displays the higher resistance of W1CR cells. (b) Microscopic images of the growth characteristics of W1 cells (left) and W1CR cells (right) on agarose-coated surfaces. W1 cells tend to form closer cell aggregates. (c) 3D-spheroid formation of W1 cells (left) and W1CR cells (right) on agarose and (d) comparison of the impact of 2D and 3D cell cultivation on EC50 values of cisplatin cytotoxicity. Therefore, the ratio of EC50 values for 3D and 2D (detected by resazurin assay) was calculated and illustrated. All data are means of at least n = 3 (±SEM). (e) Scatter plot of upregulated and downregulated genes (fold change >5 / <−5) in W1CR compared to W1 cells in an untreated state. An exact list of the deregulated genes is given as an excel file in the Supplementary Materials (dereg_genes_W1CRvsW1.xlxs) (f) Chord plot representing an association between deregulated genes of W1CR cells and impacted GO terms. Additionally, a heatmap was performed and is shown in the Supplementary Materials (HM_related_to_Fig1f_W1CR_vs_W1.tiff).

