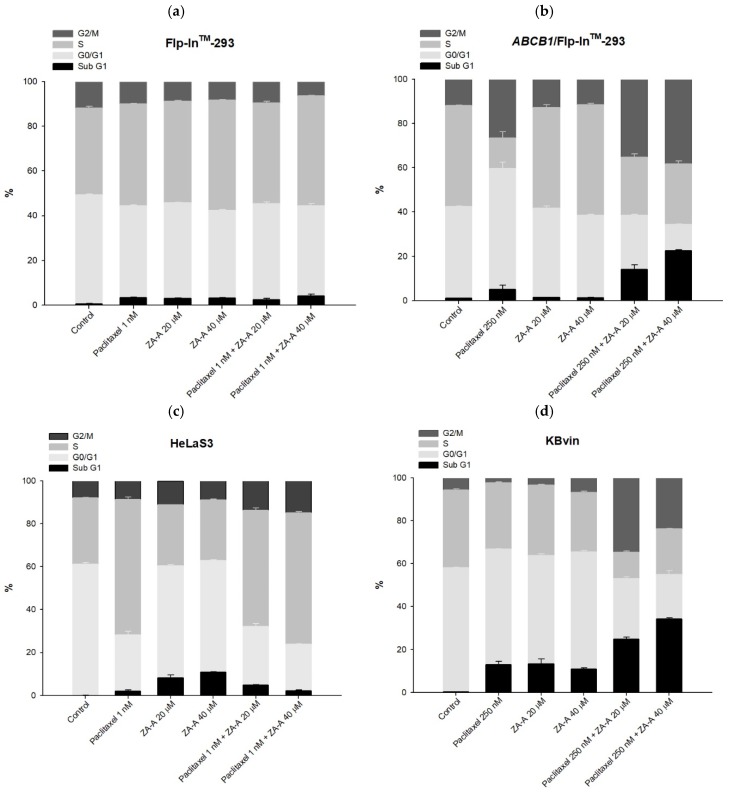
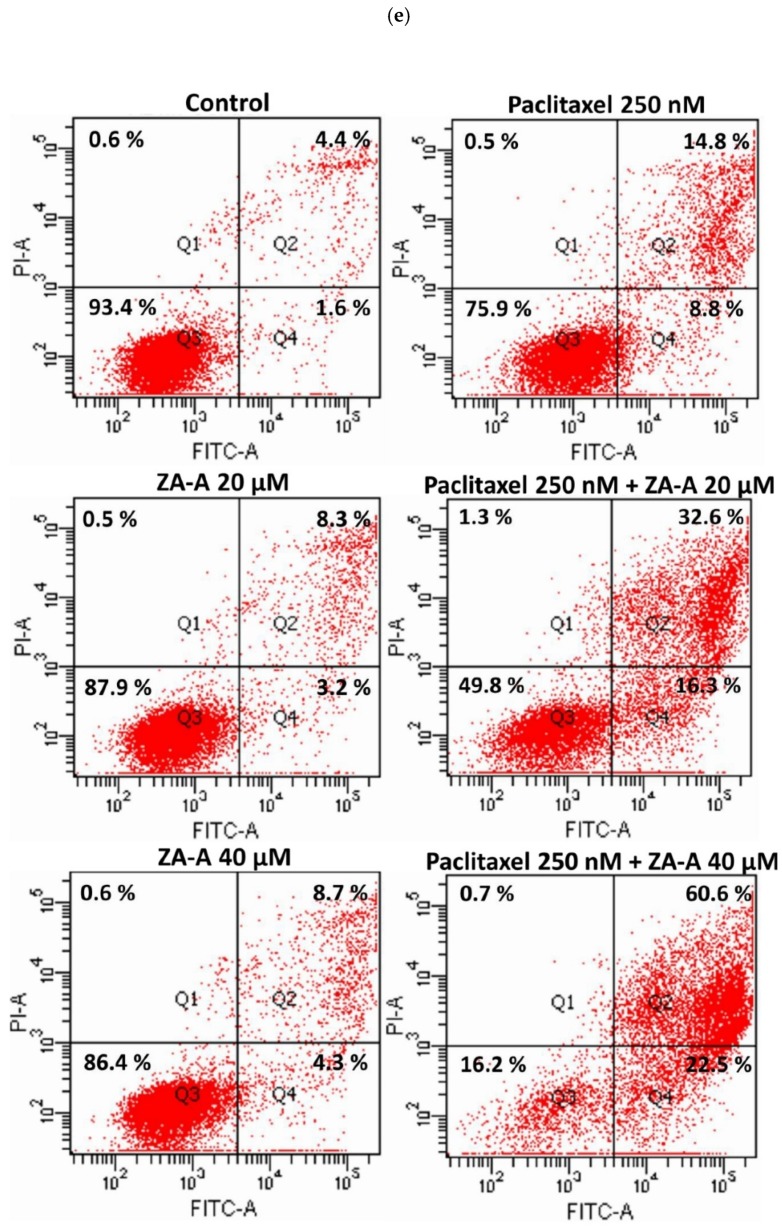
Figure 4.
The cell cycle and apoptosis analyses of ZA-A and paclitaxel combinatorial treatment. (a), (b), (c) and (d) The cell cycle distribution of 72 h treatment in Flp-InTM-293, ABCB1/Flp-InTM-293, HeLaS3 and KB/VIN, respectively. Data were presented as mean ± SE of at least three experiments, each in triplicate. (e) The apoptosis phenomenon of 72 h treatment in KB/VIN cell line. Apoptosis and necrosis status of each sample was determined by annexin V (X-axis FITC) and PI (Y-axis PI). Cells distributed in Q1, Q2, Q3 and Q4 represent necrosis, late-apoptosis and normal and early-apoptosis, respectively.


