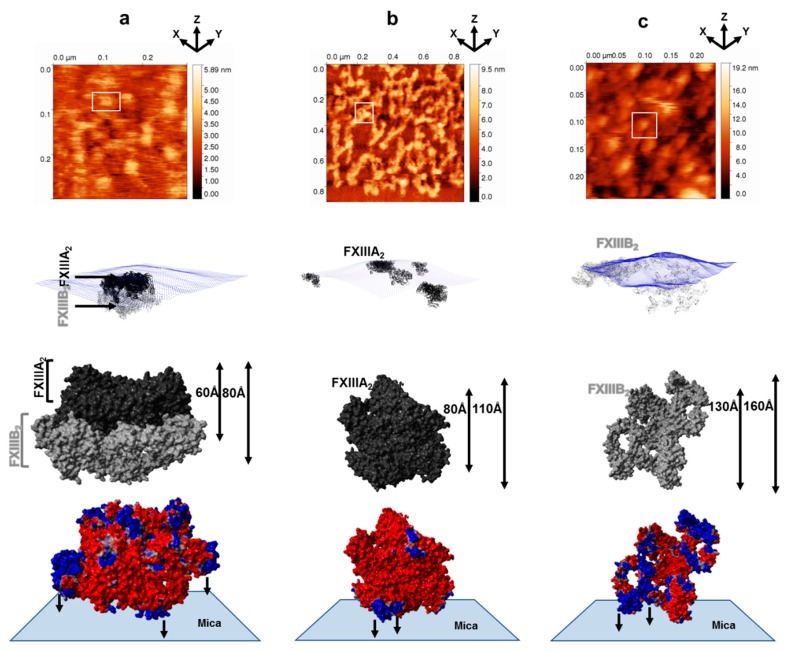
Figure 1.
Conformational state of factor XIII (FXIII) complex, FXIII-A, and FXIII-B subunits by atomic force microscopy (AFM). Figure 1 is split row wise into panels a, b, and c running top to bottom. (a) goes top to bottom in the following order for the AFM- and AFM-based docking of the best FXIII-A2B2 complex model, i.e., the topmost image is the raw AFM image with the docking pose of one of the crops below it. In the docking pose, the topography is depicted as blue dots while the different docked complexes (of model one only) are depicted in black (FXIII-A2) and gray (FXIII-B2) ribbon format. Below the docking pose is a molecular surface-based representation of FXIII-A2B2 complex as it would be viewed in one of the many poses it would adopt while adhering to the mica in the AFM instrument. The minimum and maximum heights that this pose is likely to have, are indicated to the right. The FXIII-A and FXIII-B subunits are depicted in black and gray color, respectively. The lowermost image is PME electrostatic surface structural representation of the same pose depicted in alignment with the hypothetical mica surface to which it adheres. (b,c) panels follow the same trend as (a), only they represent the FXIII-A dimeric crystal structure and the dimeric unbound FXIII-B model, respectively.

