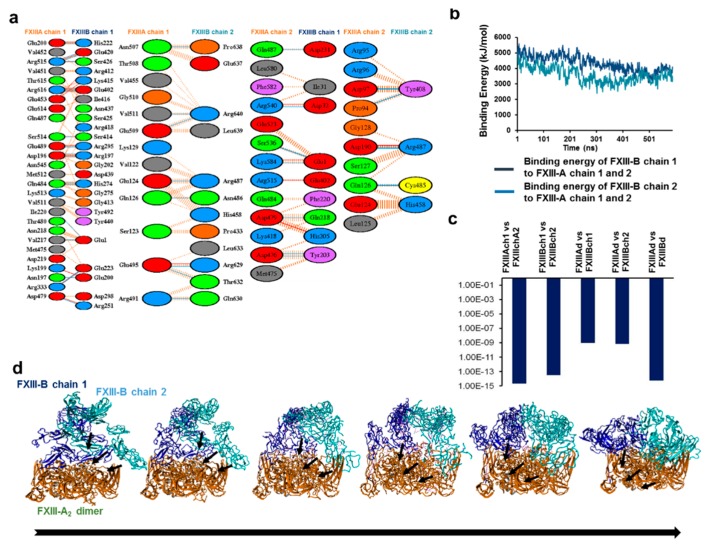
Figure 5.
Interdomain interactions, binding affinity, and the assembly of the best FXIII-A2B2 complex model structure. (a) shows the different type of interactions between the different chains of FXIII-A and FXIII-B subunits within the best FXIII-A2B2 complex model structure. (b) shows a comparative binding energy graph of the two individual chains of the FXIII-B subunit to the FXIII-A2 dimer as calculated during the MD simulation conducted in the best FXIII-A2B2 complex model structure. (c) show the comparative predicted binding affinities for different structural entities within the best FXIII-A2B2 complex model structure as calculated over the PRODIGY server [38]. These entities are abbreviated as: FXIII-Ach1/FXIII-Ach2, FXIII-A subunit chain 1 and 2; FXIII-Bch1/FXIII-Bch2, FXIII-B subunit chain 1 and chain 2; FXIII-Ad/FXIII-Bd, FXIII-A and FXIII-B subunit dimers, respectively. (d) shows the conformational transitions taking place in the FXIII-B dimer during its association with the FXIII-A2 subunit dimer. Both the subunits are depicted in ribbon format. Solid arrows represent the conformations adopted by FXIII-B during its association. The FXIII-A2 subunit dimer is colored orange, whereas the individual monomers of FXIII-B subunit dimer are colored blue and cyan, respectively.

