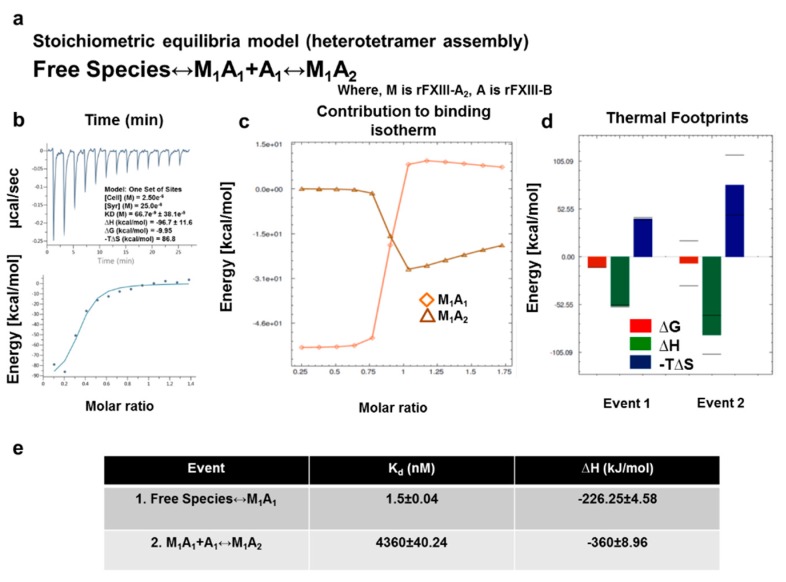
Figure 6.
In-solution associations of FXIII subunits studied by ITC. (a) is the equation depicting the stoichiometric binding equilibrium model, followed for the analysis of data derived from ITC (model was generated in Affinimeter using model builder approach). (b) represents the titration of 2.5 µM rFXIII-A2 (in cell), with 25 µM FXIII-B subunits (in syringe). The upper image of this panel is the raw data depicting the heat change upon each injection; the lower image in this panel is the normalized data, with integrated heat change plotted against the concentration ratio of rFXIII-B vs. rFXIII-A2. (blank controls not shown). A solid black line represents the corresponding fit obtained in Origin software using one-set of binding mode. (c,d) are based on Affinimeter analyses depicting the contribution of individual reactants of the equation (a) towards the isotherm. The heat signatures depicting the free energy changes, changes in enthalpy, and entropy in the two events explained in (a), respectively. (e) is a table explaining the two thermodynamic events, and their corresponding dissociation constants (Kd) and changes in enthalpy (∆H).

