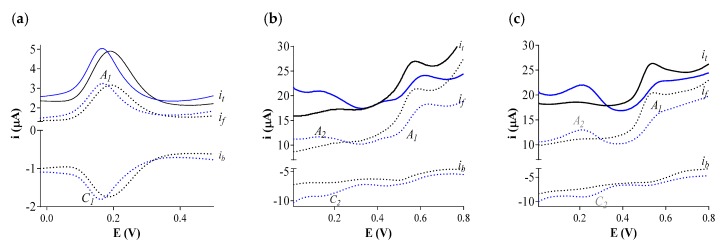
Figure 2.
SW voltammograms of 25 µM ArOH in pH 7.4 0.1 M phosphate buffer vs. Ag/AgCl reference electrode using a GCE working electrode, scan rate 0.05 V s−1. (a) Ole; (b) Tyr; (c) p-Cou. A1: first oxidation peak; C1: cathodic peak on the reverse scan when visible. Black color: first scan; Blue color: second scan. it: total current; if: forward current; ib: backward current.

