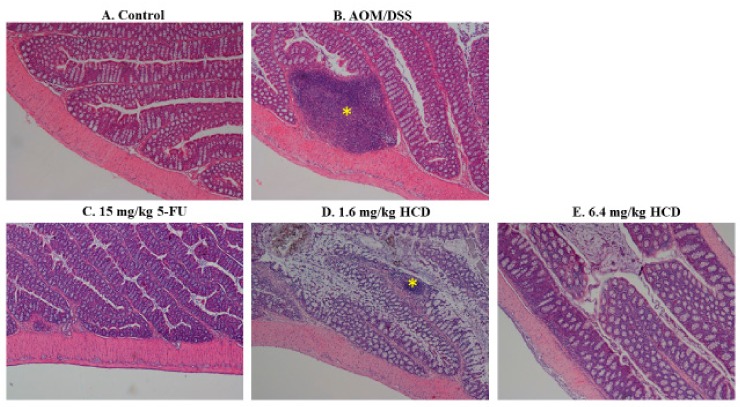
Figure 2.
Histological changes of intestinal lymph nodes in HCD-treated mice with inflammatory bowel disease (IBD). The intestinal lymph nodes of (A) the control, (B) mice with AOM/DSS induction, and mice with AOM/DSS induction followed by (C) 15 mg/kg B.wt of 5-FU, (D) 1.6 mg/kg B.wt, and (E) 6.4 mg/kg B.wt of HCD treatment (n = 5 in each group) were stained and photographed. The yellow asterisk indicates the lymph node in the intestine. Magnification = ×40.

