Fig. 3.
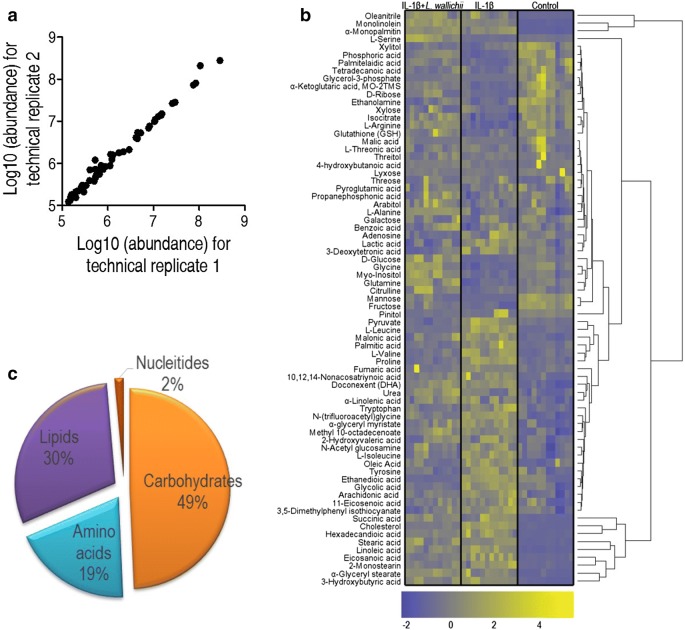
Metabolomics profiling of primary mouse chondrocyte treated by IL-1β or IL-1β + L. wallichii. a Reproducibility of metabolomic data used in the discovery phase. Metabolite abundances quantified in cell samples over two technical replicates are shown. Correlation coefficient between technical replicates varies between 0.995 and 0.999. This plot presents the two replicates with the weakest correlation of 0.995. b Hierarchical clustering showing the 73 metabolites. Blue and yellow present decrease and increase of metabolites relative to the median metabolite level, respectively (see color scale). c Metabolic category of 73 identified metabolites

