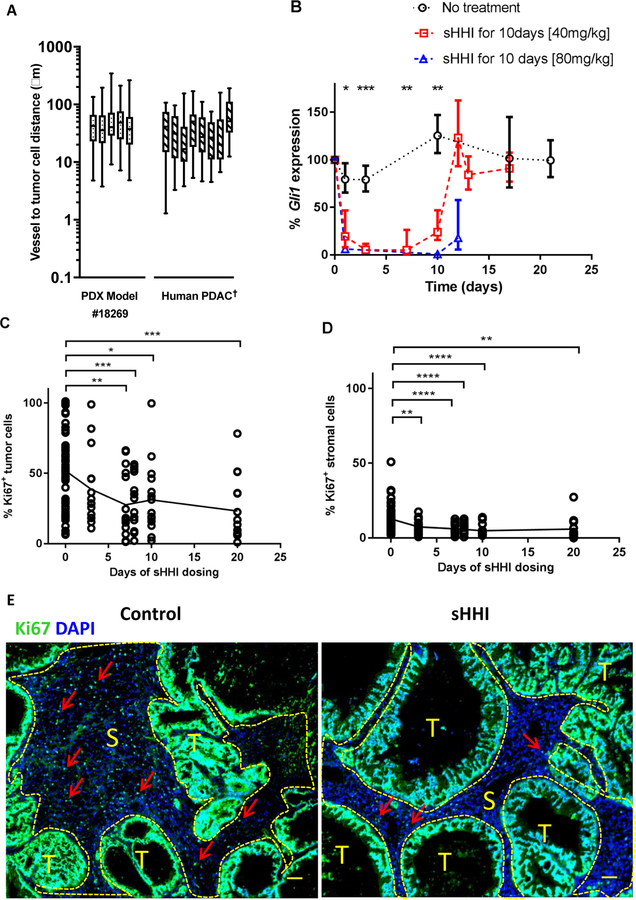
Figure 1. Characteristics of PDX model and responses to sHH inhibition.
A, Microvessel-to-tumor cell distance. The distance from each CD31+ microvessel to the five nearest tumor cells was measured for the PDX model #18269 and the mean value is reported. Center bar is the median, box represents range of the median 50%, and vertical bars show the minimum and maximum. †For comparison, data for human PDAC tumors are re-plotted from (4). B-D, asterisks indicate statistically significant differences from control, based on post hoc unpaired t test with Welch’s correction for unequal sample numbers and variances: * p≤0.05; ** p≤0.01; *** p≤0.001; **** p≤0.0001; other statistical testing as indicated below. B, Time course of murine (stromal) Gli1 expression inhibition by sHHI. NVP-LDE225 (40mg/kg/day) was administered p.o. daily to tumor-bearing mice for 10 days. One-way ANOVA: group means differ at p=0.0003. Quantification of proliferating cells during 20 days of sHHI treatment in C, tumor regions and D, stromal regions. Regions were segmented manually based on a DIC image of each fluorescence field. Each time point consisted of n=3 mice in the sHHI treatment group and n=12 mice in the control group (time = 0). Symbols show the data for 5 random fields (20X objective) from each tumor sample in each group; C, one-way ANOVA p=0.0002; D, p=0.0001. E, Typical image of Ki67 proliferation antigen staining (green); cell nuclei were counterstained with DAPI (blue). The image encompasses nearly the entire tumor. (S): stromal areas outlined with yellow dashed line; (T): tumor cell regions. Red arrows: representative Ki67+ cells in stroma. Scale bar: 100μm.

