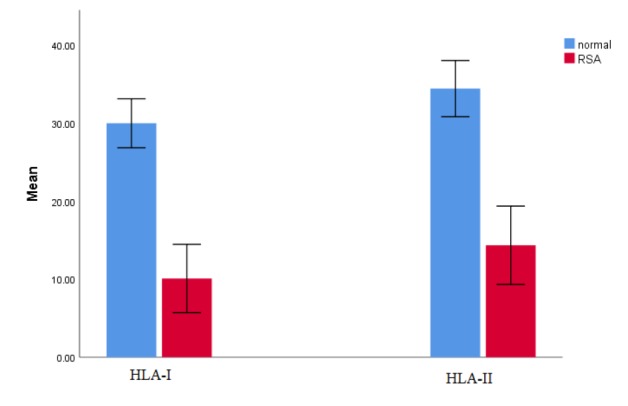
Fig. 2.

The independent sample t-test was used to compare the mean percentage of HLA class I and II in the URSA and control groups. *: Considered significant in comparison with the control group. The mean percentage ± SD of HLA class I in the URSA group is 10.1±2.2, and in the control group is 29.9±1.6; P-value is 0.0001. The mean percentage of HLA class II in the URSA group is 14.3±2.5, and in the control group is 34.4±1.8; P-value is 0.0001
