Fig. 1.
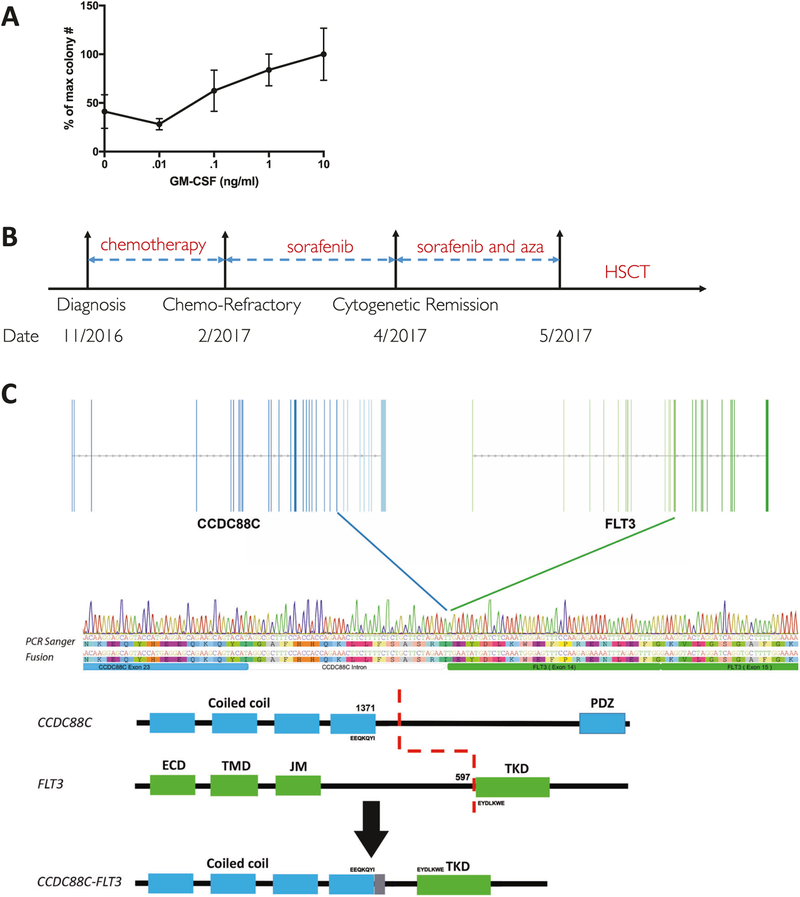
Clinical course related to CCDC88C–FLT3 fusion. a Colony forming assay of patient PBMCs with increasing concentrations of GM-CSF (mean ± SEM is displayed, n = 4, N = 1). b Schematic timeline of JMML patient course (5-azacitidine is abbreviated as Aza). c Schematic illustration of CCDC88C–FLT3 fusion: the top panel illustrates exon structure indicated by blue (CCDC88C) or green (FLT3) vertical lines. The middle panel shows a Sanger sequence trace from patient cDNA aligned with an annotated sequence of the fusion junction. The lower panel shows an illustration of protein domains from both partners retained in the fusion

