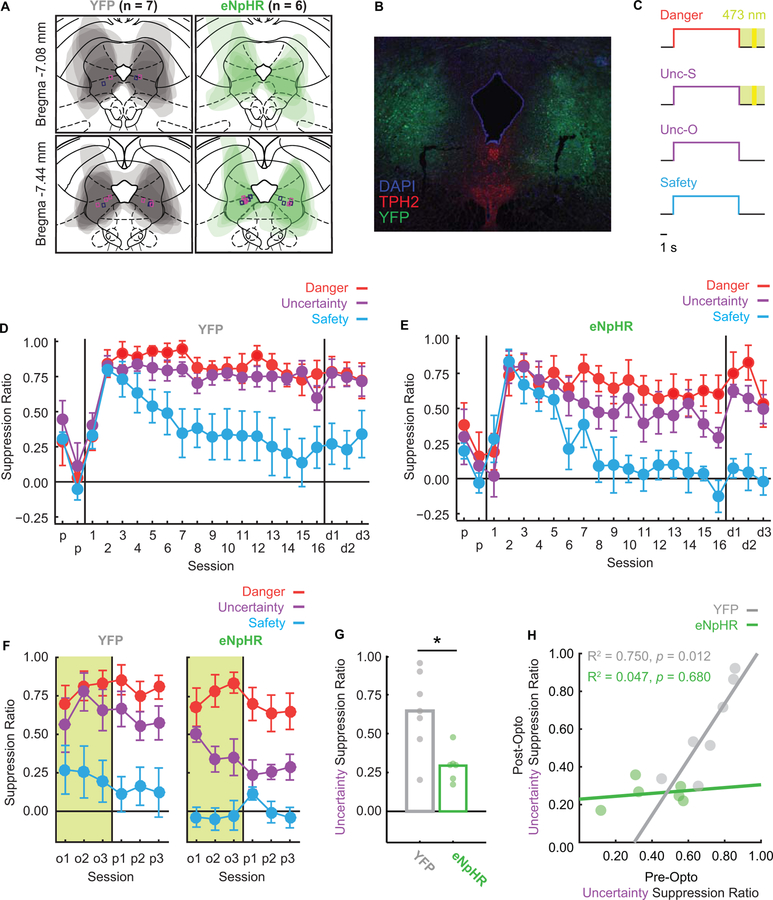
Figure 2. VlPAG optogenetic inhibition during foot shock decreases fear to uncertainty.
A Viral transfection extent was mapped for all YFP (grey) and eNpHR (green) rats, and average transfection extent can be seen in their overlaid tracings. Rectangular markers indicate fiber optic ferrule placements (magenta = females; navy = males) were all within or on the border of vlPAG bounds.
B Representative viral transfection is shown with YFP (green), TPH2 (red), and DAPI (blue). Fiber optic ferrule placement can be seen in the vlPAG in both the left and right hemispheres. Note ferrule placement shows exaggerated damage due to immunohistochemistry processing.
C During optogenetic sessions, green-light illumination began at cue offset, continued during the 0.5-s shock (yellow period), and lasted 1.5 s after shock for a total of 4 s. Note illumination never occurred during cue periods.
D Mean ± SEM suppression ratios for YFP rats to danger (red), uncertainty (purple), and safety (blue) are shown for the 2 pre-exposure sessions (p), 16 discrimination sessions (1–16), and 3 dummy cable discrimination sessions (d1–d3).
E eNpHR suppression ratio data shown as in C.
F Mean ± SEM suppression ratios for YFP rats (left) and eNpHR rats (right) to danger (red), uncertainty (purple), and safety (blue) over the 3 sessions of optogenetic manipulation (o1–o3) and 3 post-manipulation sessions (p1–p3).
G Mean suppression ratios to uncertainty during the last two sessions of optogenetic manipulation and the three post-manipulation sessions (5 sessions total) is shown for YFP (gray bar) and eNpHR rats (green bar). Circles show average suppression ratios for individual rats. Asterisk indicates significance of a between subject’s t-test (p < 0.05).
H Mean uncertainty suppression ratio for the final three discrimination sessions (pre-opto) is plotted against mean uncertainty suppression ratio for the three sessions following illumination (post-opto). Data shown for each YFP (gray) and eNpHR individual (green) along with R2 and p-value.

