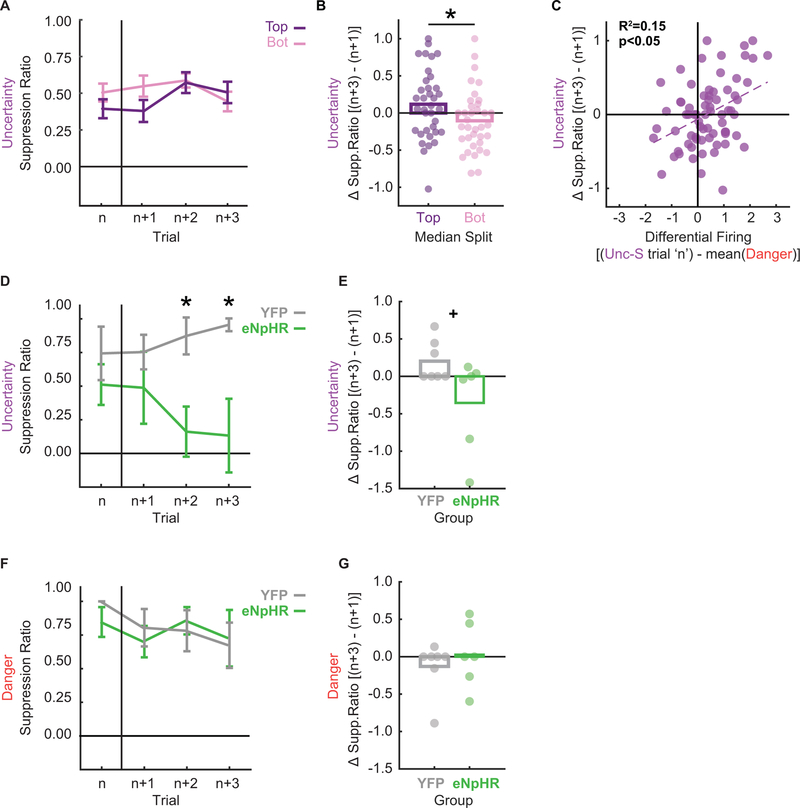
Figure 3. VlPAG +PE updates within session fear behavior.
A Mean ± SEM suppression ratio is shown for uncertainty-shock trials (n) and the next three uncertainty trials irrespective of shock or omission (n+1, n+2 and n+3). The 71 total sequences were split according to +PE firing on trial ‘n’, top 35 shown in purple, bottom 36 shown in pink.
B + or – Mean change in suppression ratio [(n+3) – (n+1)] is shown for the top 35 (purple) and bottom 36 (pink) sequences. Data as in A. Circles show differences for individual sequences. Asterisk indicates significance of a between subject’s t-test (p < 0.05).
C Differential firing [(Unc-S trial ‘n’) - mean(Danger)] was plotted against change in suppression ratio to uncertainty. Data points represent each trial n identified as in A and B. Pearson’s R2 and associated significance (p < 0.05) shown.
D Mean ± SEM suppression ratio is shown for the first uncertainty-shock trial (n) and the next three uncertainty trials irrespective of shock or omission (n+1, n+2 and n+3) for illumination session 2 (YFP, gray and eNpHR, green). Asterisks indicate significance of between subject’s t-test (p < 0.05).
E + or – Mean change in suppression ratio [(n+3) – (n+1)] is shown for YFP (gray) and eNpHR (green) rats. Data as in D. Circles show differences for individual rats. + indicates trend toward significance from a between subject’s t-test (p = 0.056).
F Suppression ratios to the danger cue were plotted for trial n (here the first danger trial on optogenetic session 2) and the subsequent 3 danger trials in order to assess trial-by-trial changes in fear. YFP (grey line) and eNpHR (green line) rats showed equivalent levels of fear and no significant changes in fear to danger across trials.
G Average change in fear to the danger cue three trials after trial n compared to the first trial after n is graphed for YFP (grey bar) and eNpHR (green bar) rats. Circles show differences for individual rats. No significant change in fear to the danger cue occurred for either group.

