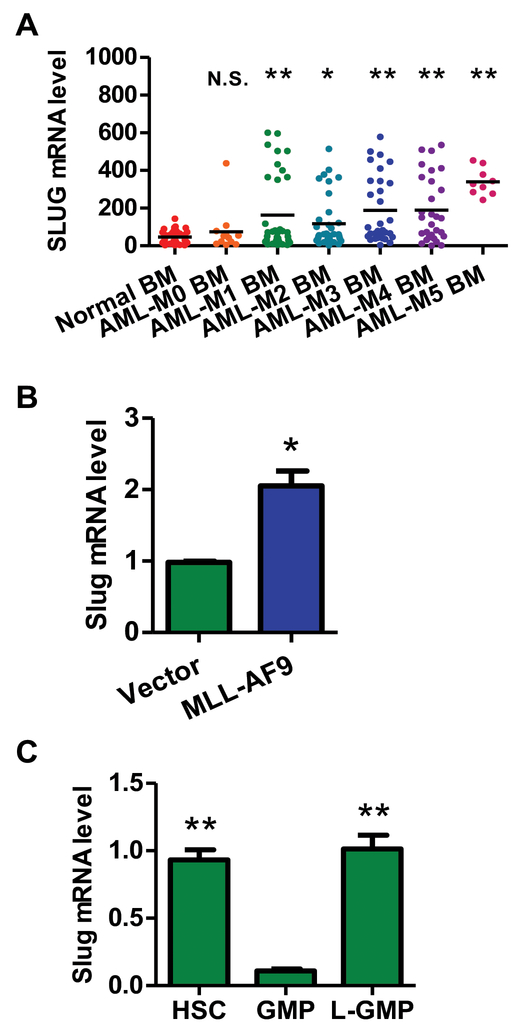
Figure 1. Slug is highly expressed in both human and mouse AML cells.
(A) The expression of SLUG between normal bone marrow cells of healthy controls and FAB subtypes of AML patients. The data were obtained from a public microarray database (GSE15061, GSE11504, GSE19429, and GSE10358) (normal patient, n = 111; M0 patient n = 12; M1 patient n = 35; M2 patient n = 36; M3 patient n = 31; M4 patient n = 29; M5 patient n = 9).
(B) qPCR analysis of the expression of endogenous Slug in mouse HSPCs transduced with retroviral vector only or retrovirus expressing MLL-AF9. Results are normalized to Gapdh expression and expressed relative to Slug expression in vector group (n = 3).
(C) qPCR analysis of the expression level of Slug in mouse HSCs, GMP and LSC. The indicated cells were sorted by flow cytometry. HSC: Lin−Sca-1+c-Kit+CD150+CD48−, GMP: Lin−c-Kit+CD34+CD16/32+, LSC (L-GMP): GFP+Linlowc-Kit+CD34+CD16/32+ (n = 3). Results are normalized to Hprt expression and expressed relative to Slug expression in GMP group (n = 3).
Data are representative of two to three independent experiments. All data are represented as mean ± SD. Two-tailed Student’s t-test were used to assess statistical significance (* P < 0.05; ** P < 0.01). See also Supplemental Figure 1, 2, and 3.

