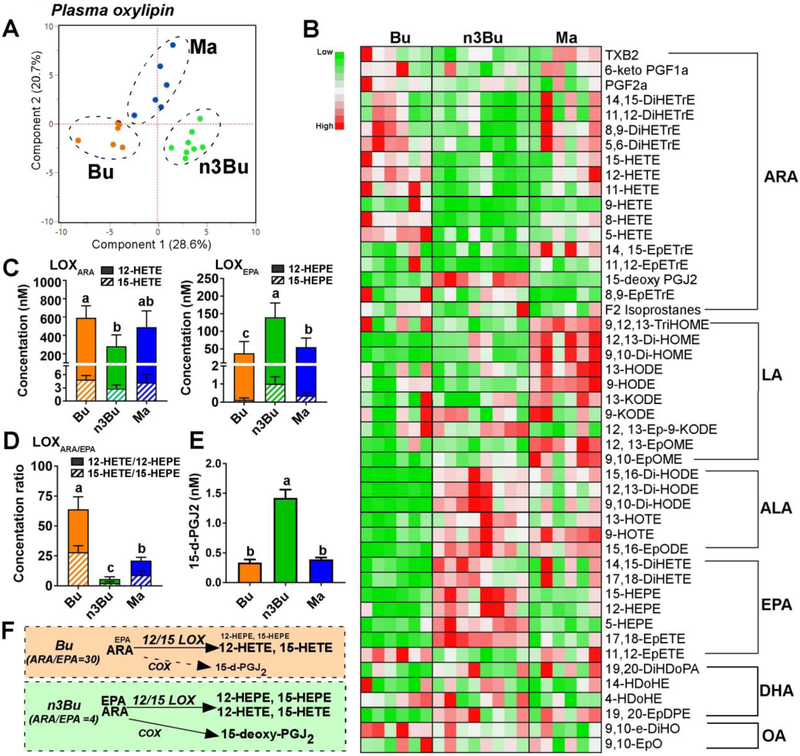
Figure 3. Plasma ALA and EPA-derived oxylipins are elevated by ALA-enriched butter.
A. Principal component analysis (PCA) score plot. B. Relative abundances heatmap by metabolite (low to high = green to red). C. Clusters of 12/15-lipooxygenase (LOX)-dependent oxylipins derived from ARA (12-HETE and 15-HETE, left) and EPA (12-HEPE and 15-HEPE, right). D. Ratio of ARA- to EPA-derived LOX-metabolites. E. 15-deoxy-PGJ2 levels. F. Schematic representation of 20-carbon fatty acid substrate (i.e., ARA and EPA) abundance and oxylipin relative production via LOX and cyclooxygenase (COX): font size indicates relative abundance. Data are mean ± SEM for Bu (n=6), Ma (n=6) and n3Bu (n=8). Treatments with different letters are significantly different from one another (P<0.05) by one-way ANOVA. Abbreviations used: DiHDoPE, dihydroxydocosapentaenoic acid; DiHETE, dihydroxy-eicosatetraenoic acid; DiHETrE, dihydroxy-eicosatrienoic acid; DiHODE, dihydroxy-octadeca(di)enoic acid; DiHOME, dihydroxy-octadeca(mono)enoic acid; HDoPA, hydroxyl-docosapentenoic acid; EpDPE, epoxyedocosapentaenoic acid; EpETE, epoxyeicosatetraenoic acid; EpETrE, epoxyeicosatrienoic acid; EpODE, epoxyoctadecadienoic acid; EpOME, epoxyoctadecamonoenoic acid; HDoHE, hydroxydocosahexaenoic acid; HEPE, hydroxyeicosapentaenoic acid; HETE, hydroxyeicosatetraenoic acid; HETrE, hydroxyeicosatrienoic acid; HODE, hydroxyl-octadecadienoic acid; HOTE, hydroxyl-octadecatrienoic acid; KETE (i.e., oxo-ETE), ketoeicosatetraenoic acid; KODE (i.e., oxo-ODE), ketooctadecadienoic acid; KOTE, ketooctadecadienoic acid; PG, prostaglandin; TriHOME, trihydroxyoctadecenoic acid; TX, thromboxane.

