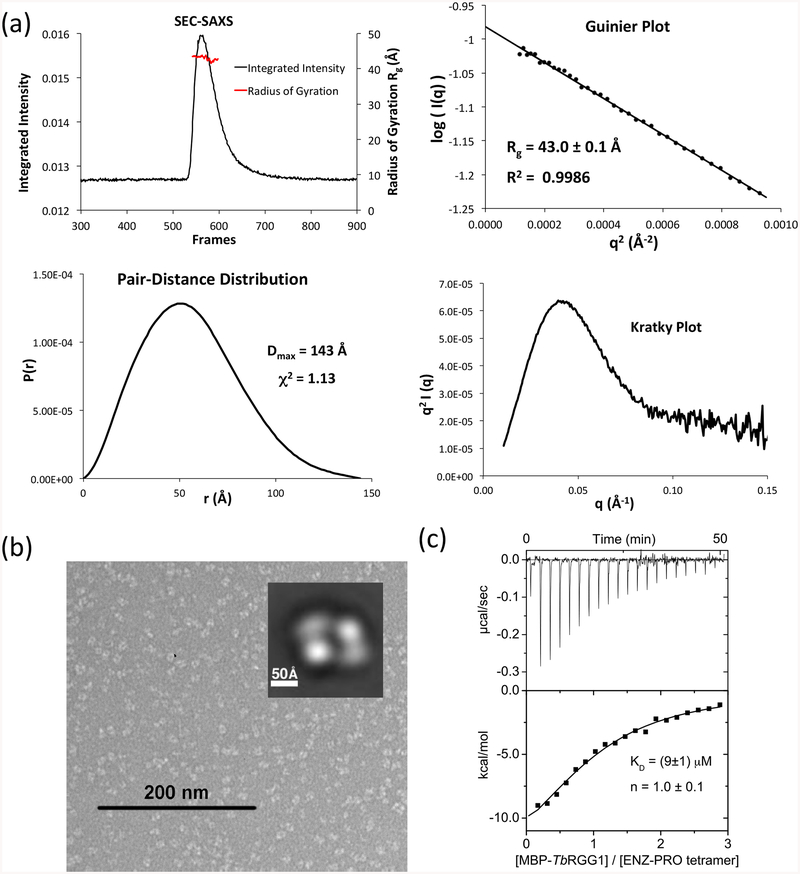
Figure 2. TbPRMT1 ENZ-PRO forms a heterotetrameric complex in solution.
(a) SEC–SAXS analysis of TbPRMT1 ENZ-PRO. Top left panel: SEC-SAXS integrated intensities (left y-axis) plotted against frame number (x-axis). The red dots indicate radius of gyration, Rg (on the right y-axis). Top right panel: Guinier plot calculated from averaging buffer-subtracted scattering intensities. The coefficient of determination, R2, is 0.9986. Bottom left panel: Pair-distance distribution function P(r), yielding a maximum molecular diameter of 143 Å. Bottom right panel: Normalized Kratky plot calculated from SEC–SAXS data.
(b) Negative-stain electron microsopy. EM micrograph with a 200 nm scale bar. Inset: Predominant 2D class average.
(c) ITC thermogram (upper panel) and plot of corrected heat values (lower panel) for binding of the heterotetrameric TbPRMT1 ENZ-PRO complex to Maltose Binding Protein (MBP)-fused TbRGG1 protein.

