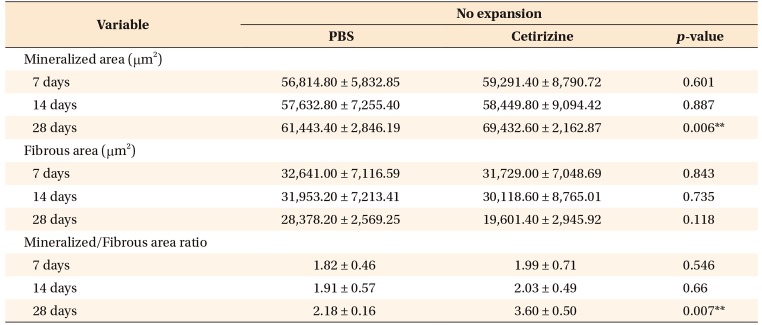
Table 2. Comparison of the mineralized area, fibrous area, and mineralized/fibrous area ratio in the no expansion group.
Values are presented as mean ± standard deviation.
Statistical significance were determined using the one-way analysis of variance followed by post-hoc least significant difference tests.
PBS, Phosphate-buffered saline.
**p < 0.01.

