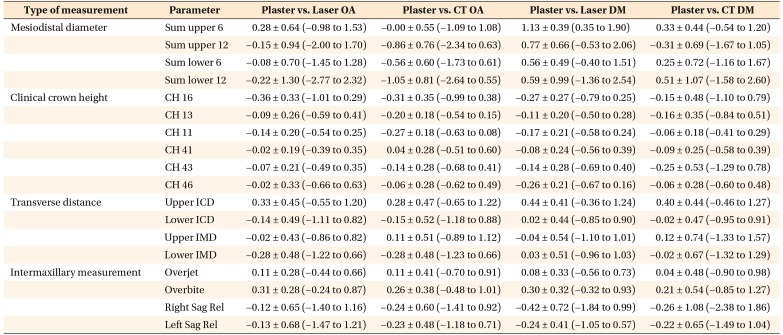
Table 4. Bland-Altman analysis of the comparison between the plaster and digital models with 95% limits of agreement.
Values are presented as mean difference ± standard deviation (minimum to maximum of 95% limits of agreement). Unit: mm.
Laser OA, Digital model produced by laser scanning and measured with the Ortho Analyzer software; CT OA, digital model produced by computed tomography (CT) scanning and measured with the Ortho Analyzer software; Laser DM, digital model produced by laser scanning and measured with the Digimodel software; CT DM, digital model produced by CT scanning and measured with the Digimodel software.
Refer to Table 1 for parameter definitions.

