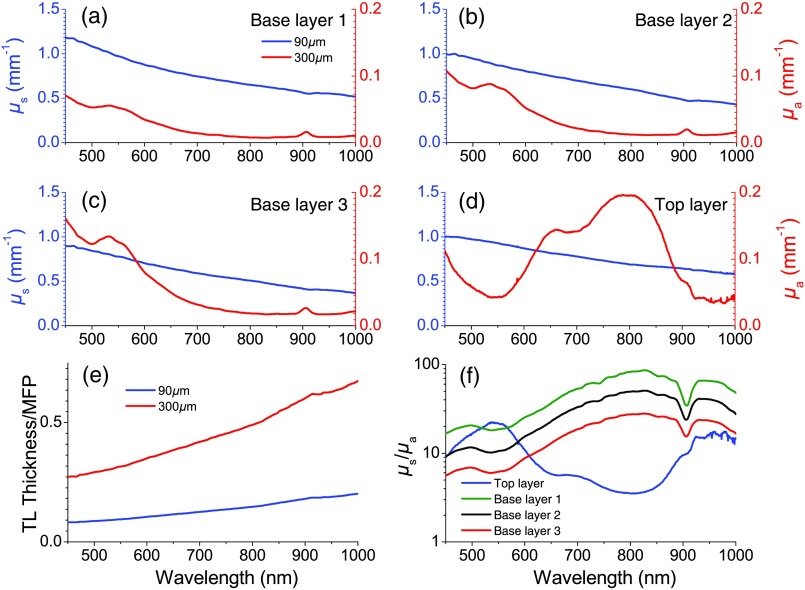
Fig. 2.
Optical properties of the phantoms. (a–d) Depict the reduced scattering coefficient (left axis) and absorption coefficient (right axis) spectra of the top layer (a) and the three possible base layers (b–d) of each phantom. (e) Provides the top layer thickness normalized by the transport mean free paths for both (blue) and (red) thicknesses of the top layer. (f) Depicts the relative scattering to absorption strength of each layer on a log10 scale. The green curve shows the top layer, the black shows base layer 1, the red shows base layer 2, and the blue shows base layer 3.

