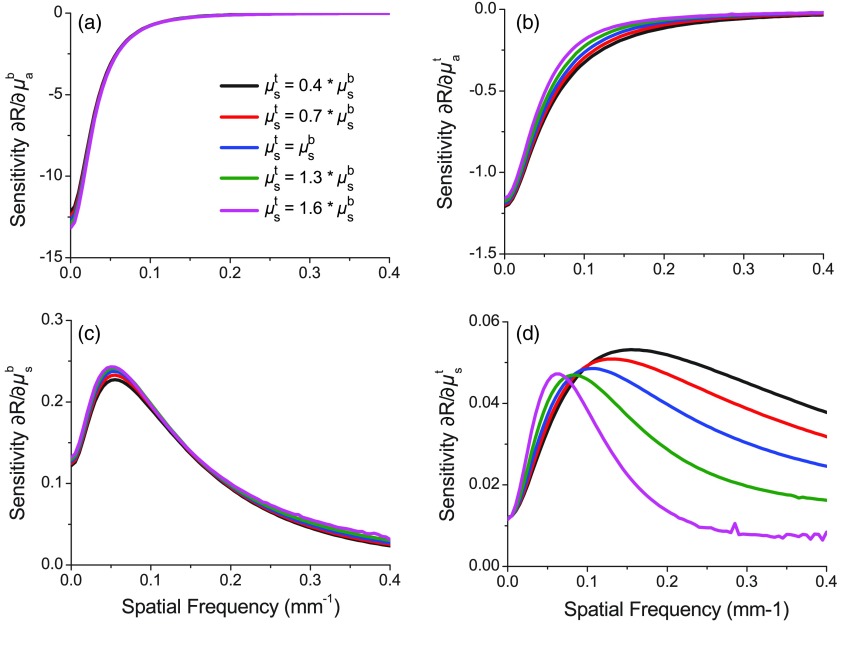
Fig. 3.
Reflectance sensitivities with respect to (a, b) absorption and (c, d) reduced scattering coefficient for (a, c) bottom and (b, d) top layers, respectively, as a function of spatial frequency for a top layer thickness of . In each plot, the black line indicates the case where . The red line indicates , the blue indicates , the green indicates , and the magenta indicates .

