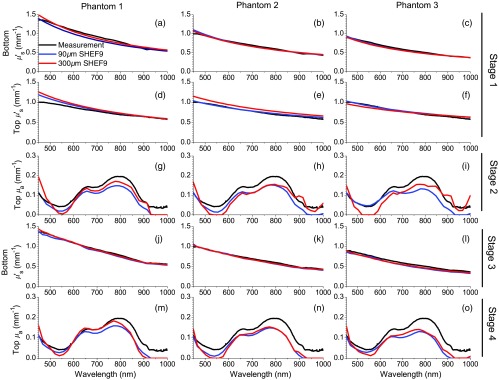
Fig. 4.
Inversion results. In all graphs, reference data are shown in black, results for a top layer are shown in blue and results for a top layer are shown in red. (a–f) The stage 1 results, in which initial guesses for top and bottom layer scattering spectra are recovered. (a–c) The reference scattering spectra for their respective base layers, and homogeneous results for data taken with the spatial frequency band. (d–f) The reference scattering spectra for the top layer alone and the homogeneous SHEF results using data from the spatial frequency band. (g–i) The top layer absorption spectra fits from stage 2, using results from stage 1 for top and bottom layer scattering. (j–l) The stage 3 results in which recovery of the bottom layer reduced scattering coefficient spectrum is refined. (m–o) The stage 4 results that provide the final result for the top layer absorption spectrum.

