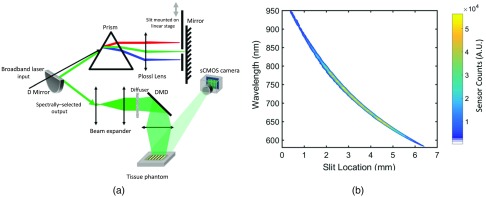
Fig. 1.
(a) Schematic representation of the hs-SFDI instrument and tissue phantom: supercontinuum input is first dispersed via a prism and imaged onto a mirror placed at the focal point of a cylindrical lens. A slit mounted on a linear stage selects the spectral output, which is spatially modulated via a DMD and projected onto the tissue phantom. The tissue phantom is made of solid silicone background with four wells that are filled with solutions of absorptive dyes and IL. (b) Slit location-central wavelength plot. Each slit location of the hs-SFDI instrument corresponds to a tuned spectral bin from the broadband source. Spectral bins are measured using a spectrometer and are shown with color-coded sensor counts.

